About dashboards and visualizations
Observability is a cornerstone of site reliability engineering (SRE). It enables engineers to gain deep insights into the health, performance, and behavior of complex systems. By collecting and analyzing telemetry data such as logs, metrics, and traces, observability helps identify and resolve issues before they impact users.
Dashboards and visualizations are critical tools in this process. They provide a clear, real-time view of system performance, making it easier to detect anomalies, track trends, and correlate events. For example:
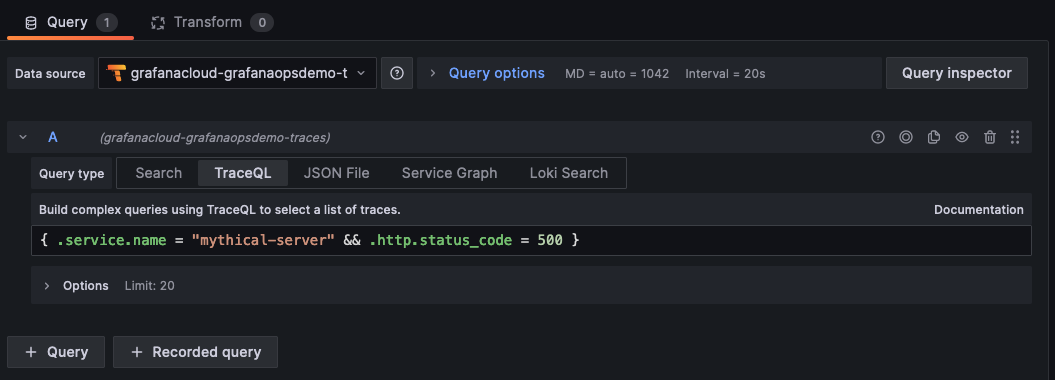
The trace table shows all traces that match the TraceQL query. While useful in seeing a list of traces, this view is of limited utility in troubleshooting.
![Create a dynamic query]()
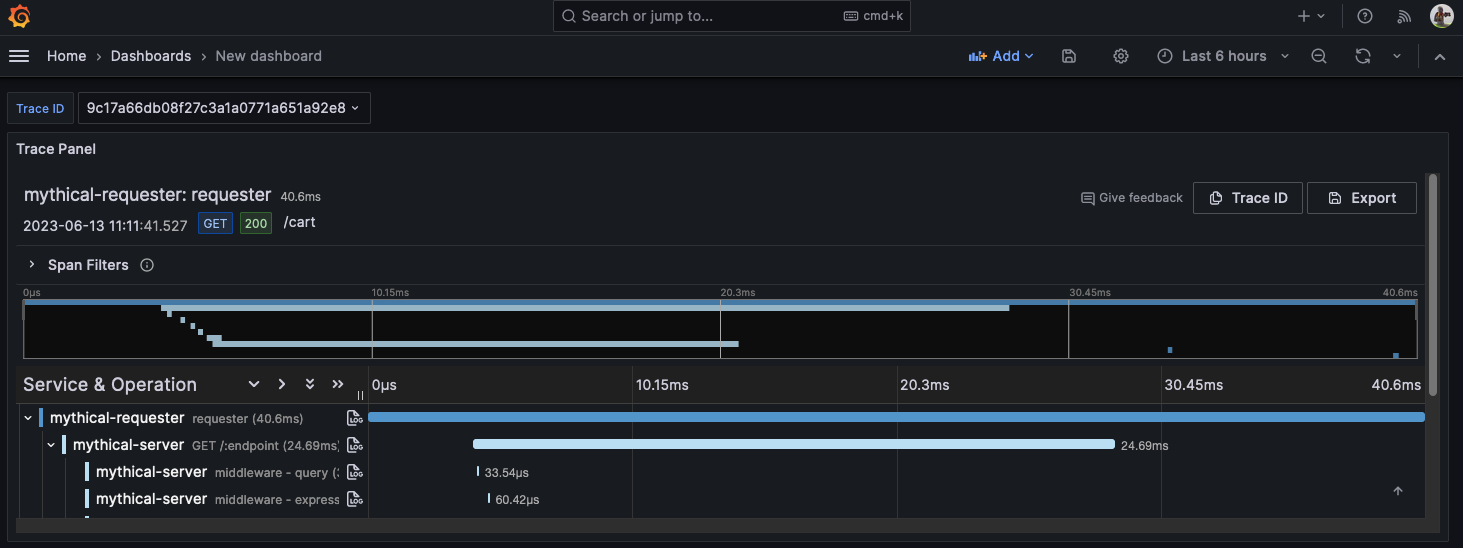
The trace panel used in conjunction with the trace table enables users to select a specific trace and see more details about the trace span.
![Results of query in trace panel]()
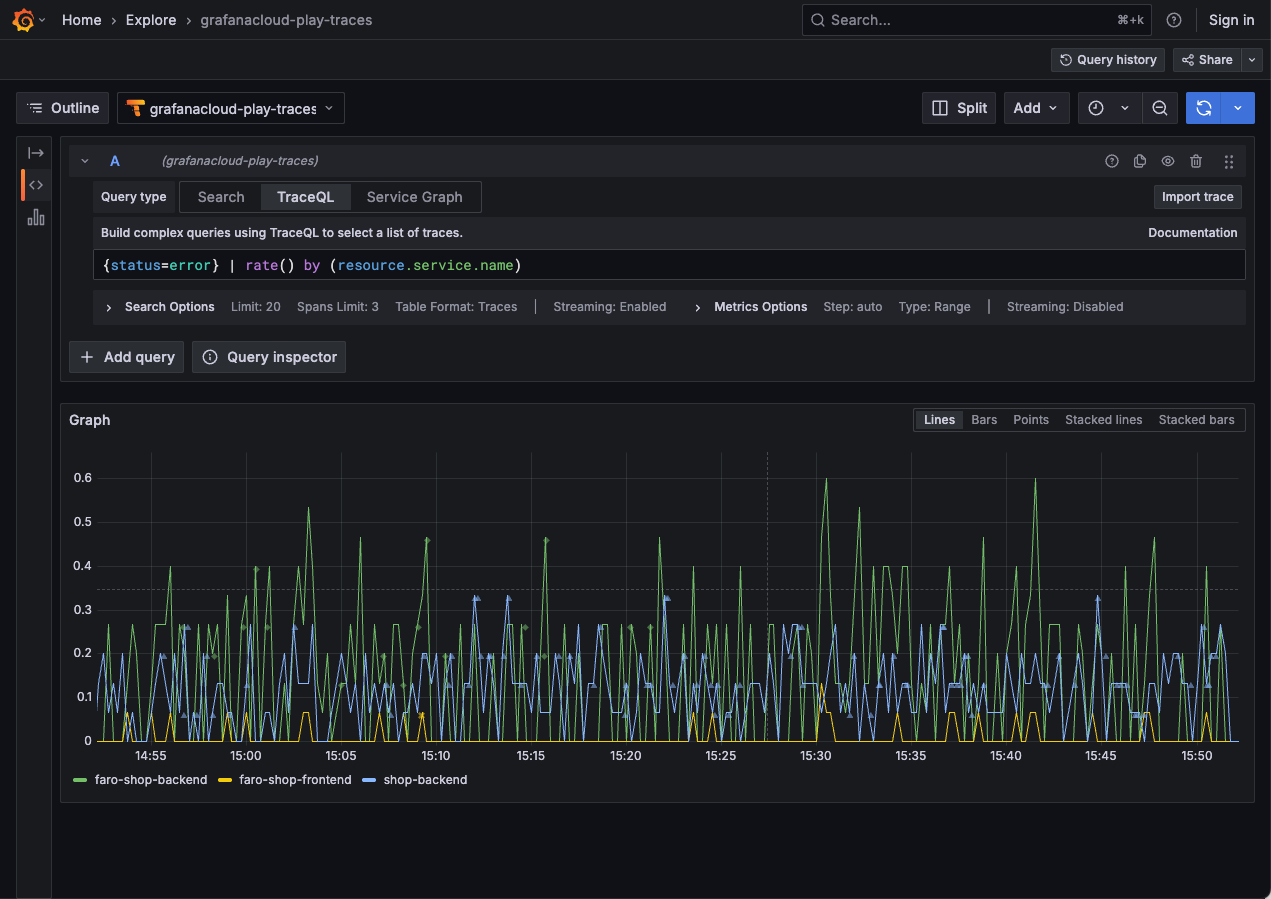
Metrics applied to traces lets you extend trace queries by applying a function to trace query results. This feature allows for ad hoc aggregation of any TraceQL query by any available dimension.
![Metrics visualization in Grafana]()
Dashboards and visualizations transform raw data into actionable insights, empowering SREs to maintain high availability, optimize resource allocation, and deliver a seamless user experience—all while saving the business money by minimizing disruptions and operational inefficiencies. By leveraging these visualizations, businesses can prevent costly downtime and maintain customer trust.
At this point in your journey, you can explore the following paths:


