
Add a dashboard variable
Grafana dashboard variables let you create dynamic and interactive views of your tracing data. Instead of having a static dashboard that always shows the same information, variables let you filter, drill down, and explore your traces without having to manually edit queries or create multiple dashboards.
Dashboard variables transform your traces dashboards from static reports into powerful, interactive investigative tools, significantly improving your ability to understand, monitor, and troubleshoot distributed systems.
In this milestone, you’ll add a dashboard variable that allows you to filter and explore trace spans based on specific trace IDs.
To add a dashboard variable, complete the following steps:
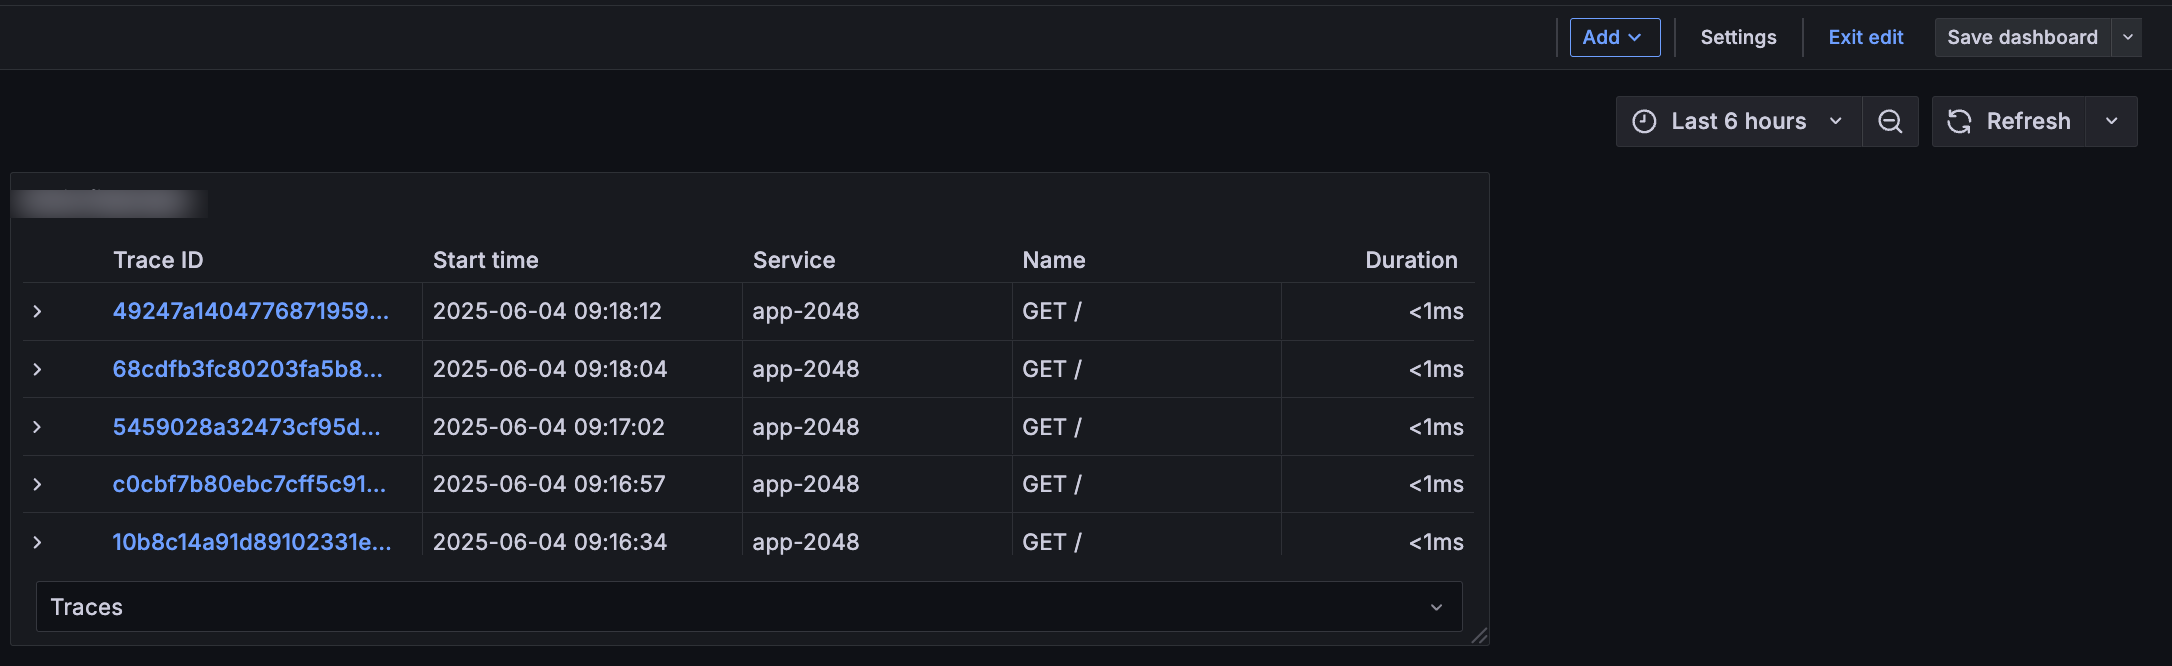
On the dashboard, click Settings.
![Image shows dashboard with Settings button]()
Click the Variables tab.
Click Add variable.
From the Variable type drop-down list, select
Custom.In the Name field of the General section enter
traceId.In the Label field, enter
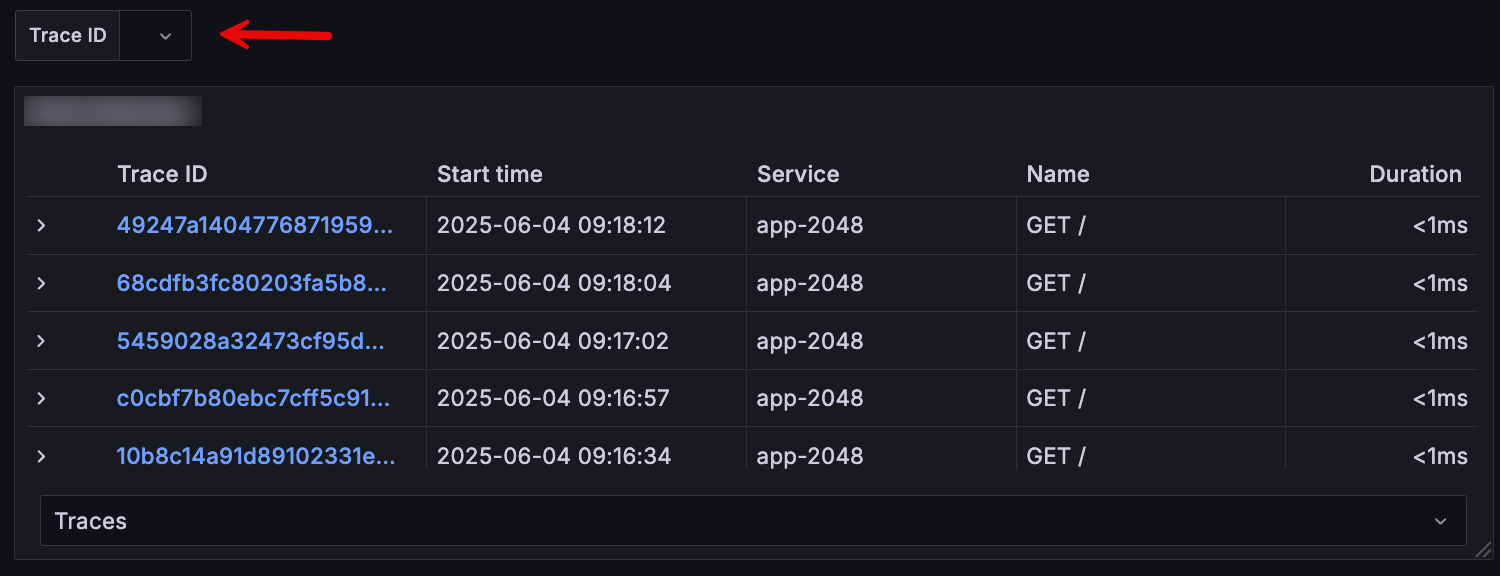
Trace ID.Click Back to dashboard.
Trace IDappears above the panel.![Image shows Trace ID field above the traces table panel]()
In the next milestone, you’ll add a traces panel that populates with trace details.
At this point in your journey, you can explore the following paths: