
Verify Prometheus metrics are written to an endpoint
To verify Prometheus metrics are written to an endpoint:
Log into the machine on which Prometheus is installed.
If required, switch to a user that has administrative privileges.
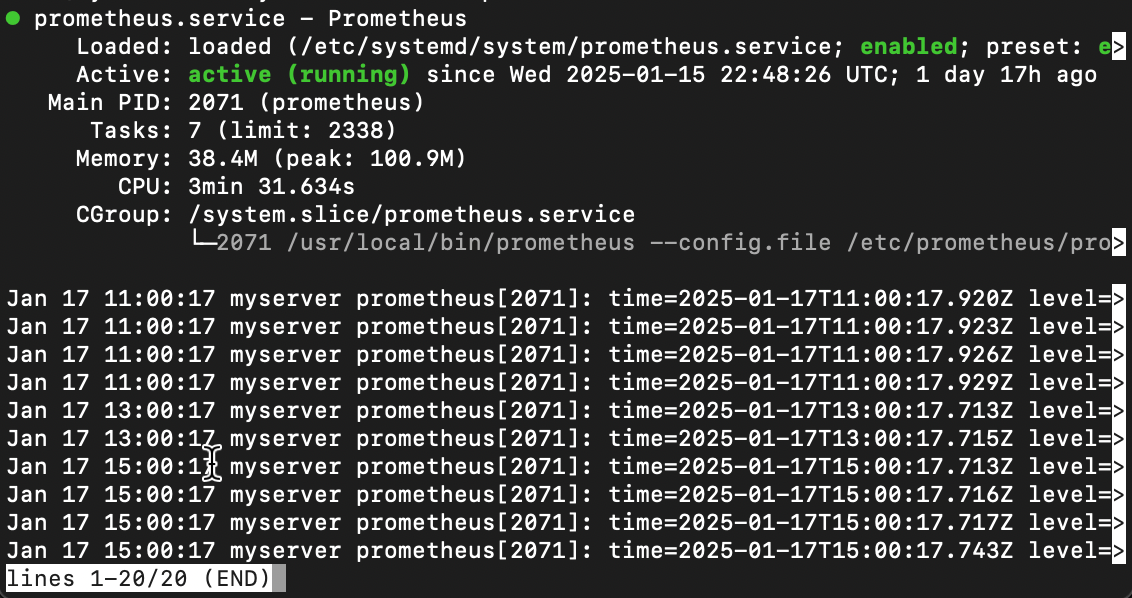
To check the Prometheus service status, run one of the following commands:
For Linux:
systemctl status prometheus.serviceFor Windows:
sc query prometheusYou should see something similar to the following:
![Picture that shows the Prometheus service up and running]()
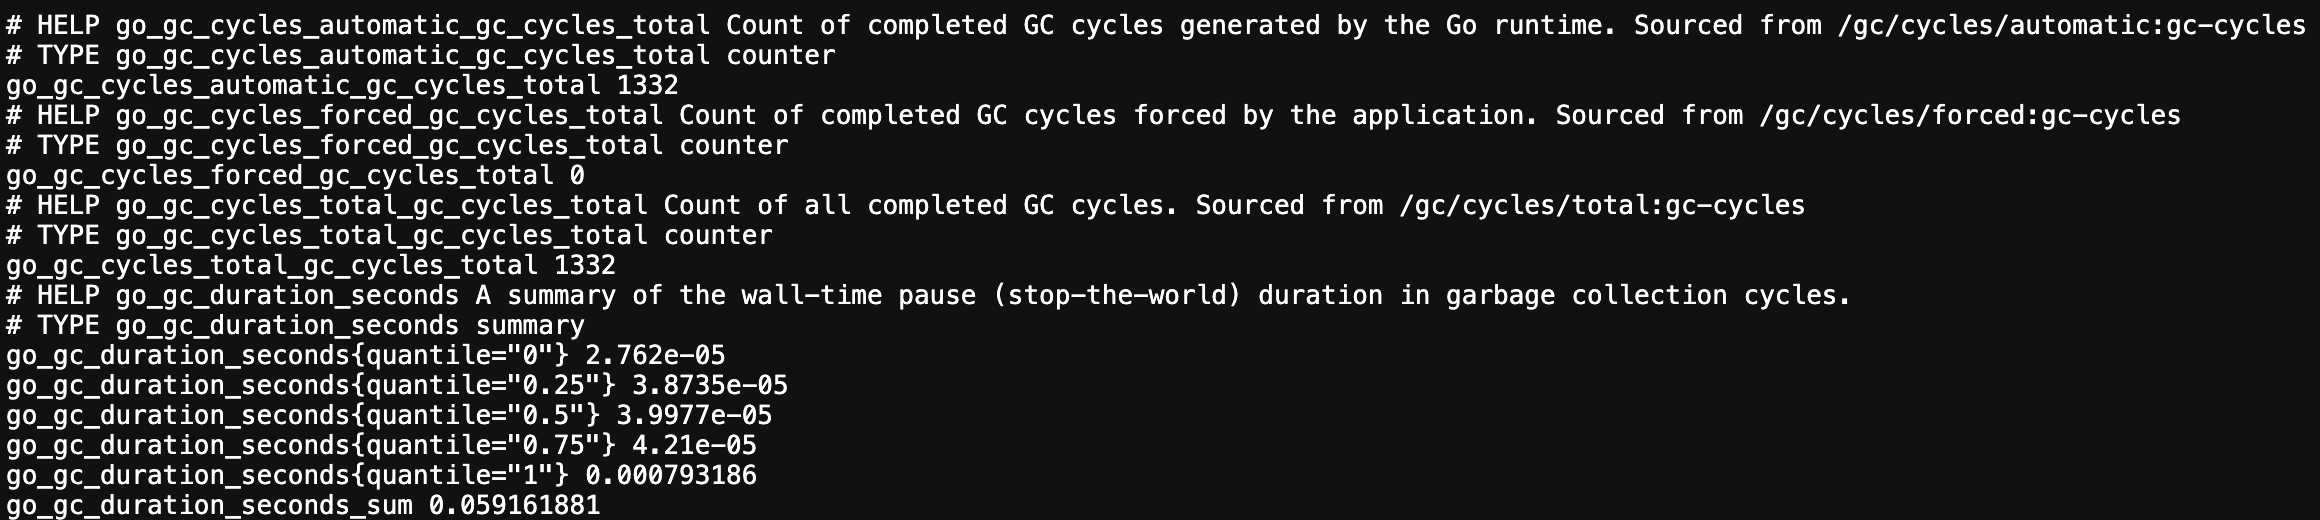
To ensure that Prometheus is capturing the metrics, open a browser tab and navigate to the metrics endpoint URL.
For example, navigate to
http://localhost:9090/metricsYou should see something similar to the following:
![Picture that shows metrics in a browser tab]()
Tip
Consult the Prometheus documentation if you are unable to run the Prometheus service or can’t verify that Prometheus is capturing metrics.
Troubleshooting options
Please tell us what didn't work:
At this point in your journey, you can explore the following paths:
Send data from a Prometheus instance
Send data from multiple Prometheus instances
Send data from multiple high-availability Prometheus instances