
Verify Prometheus data source query successful
As the final step in your journey, complete the following steps to confirm that you’ve successfully connected to the Prometheus data source:
In Grafana Cloud, click Drilldown > Metrics.
Click Let’s start!
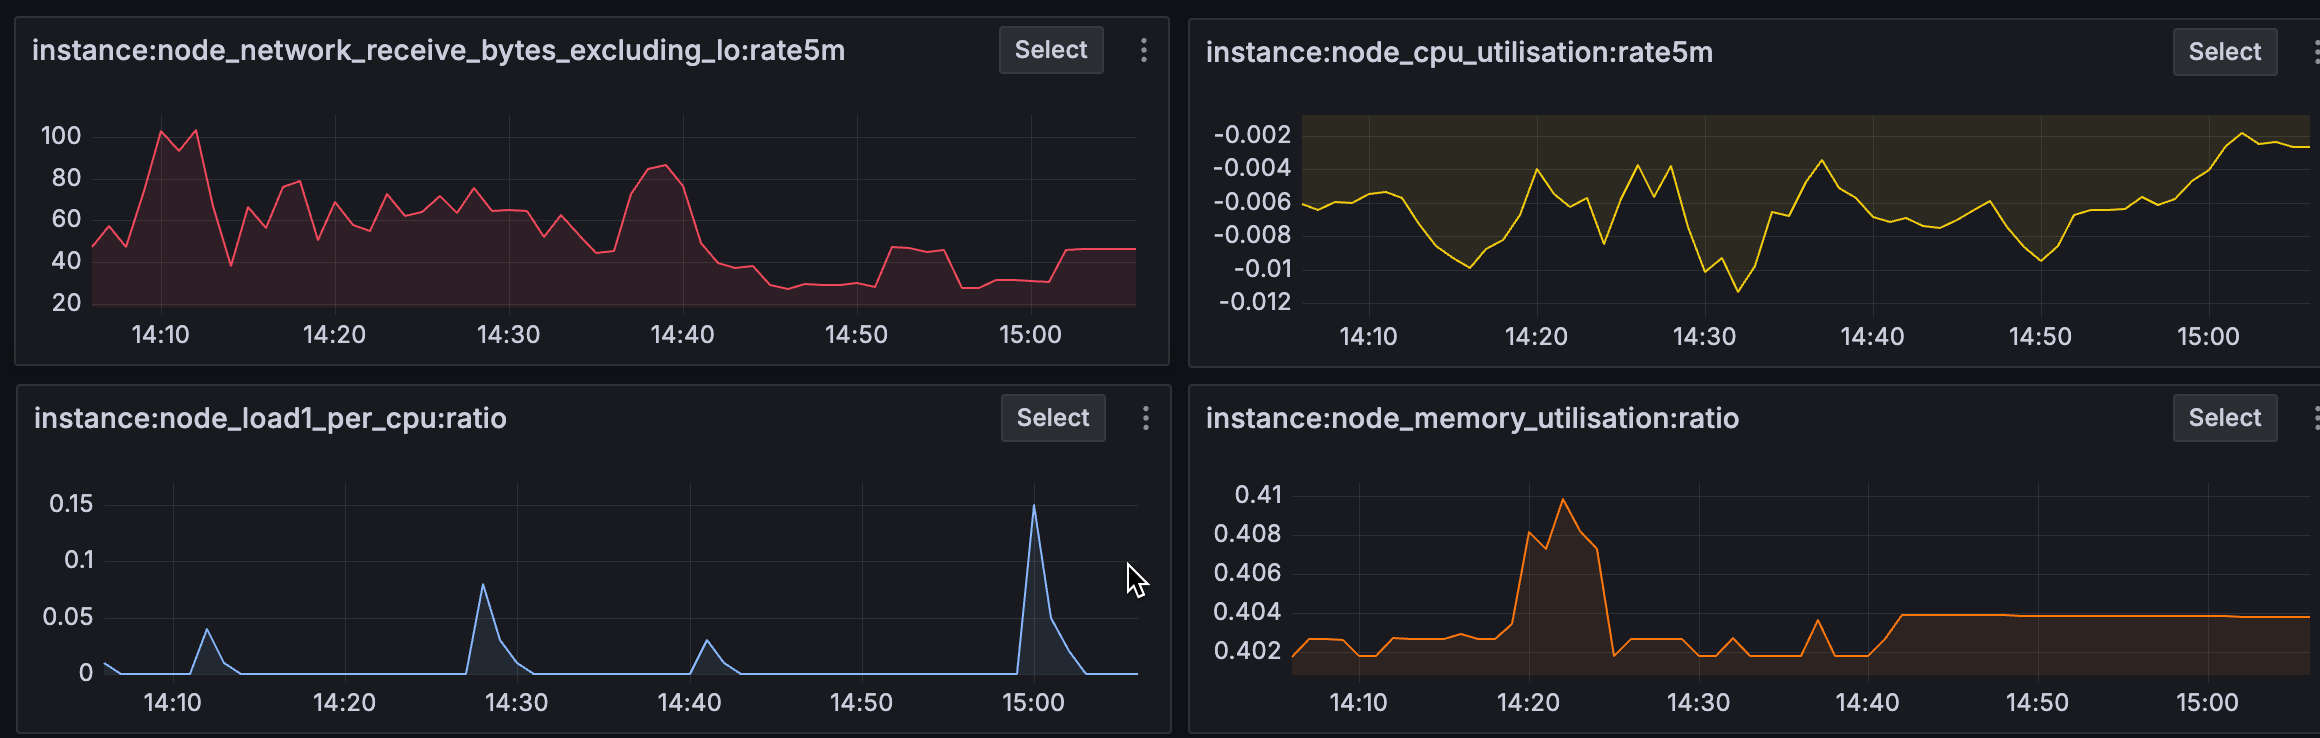
You should see something similar to the image below that shows Prometheus metrics in the Grafana Drilldown Metrics app.
Were you successful?
Super! You can move to the next step.
Troubleshooting options
Explore the following troubleshooting topics if you need help:
Please tell us what didn't work:
Need more support? Check out these helpful resources.