
About macOS integration pre-built dashboards
The macOS integration provides two pre-built dashboards that you can use right away to begin monitoring the health of your system and troubleshooting issues. In this step of the journey, you’ll become familiar with these pre-built dashboards.
Did you know?
If you don’t see any logs or metrics, try switching the data source using the drop-down at the top of the dashboard.
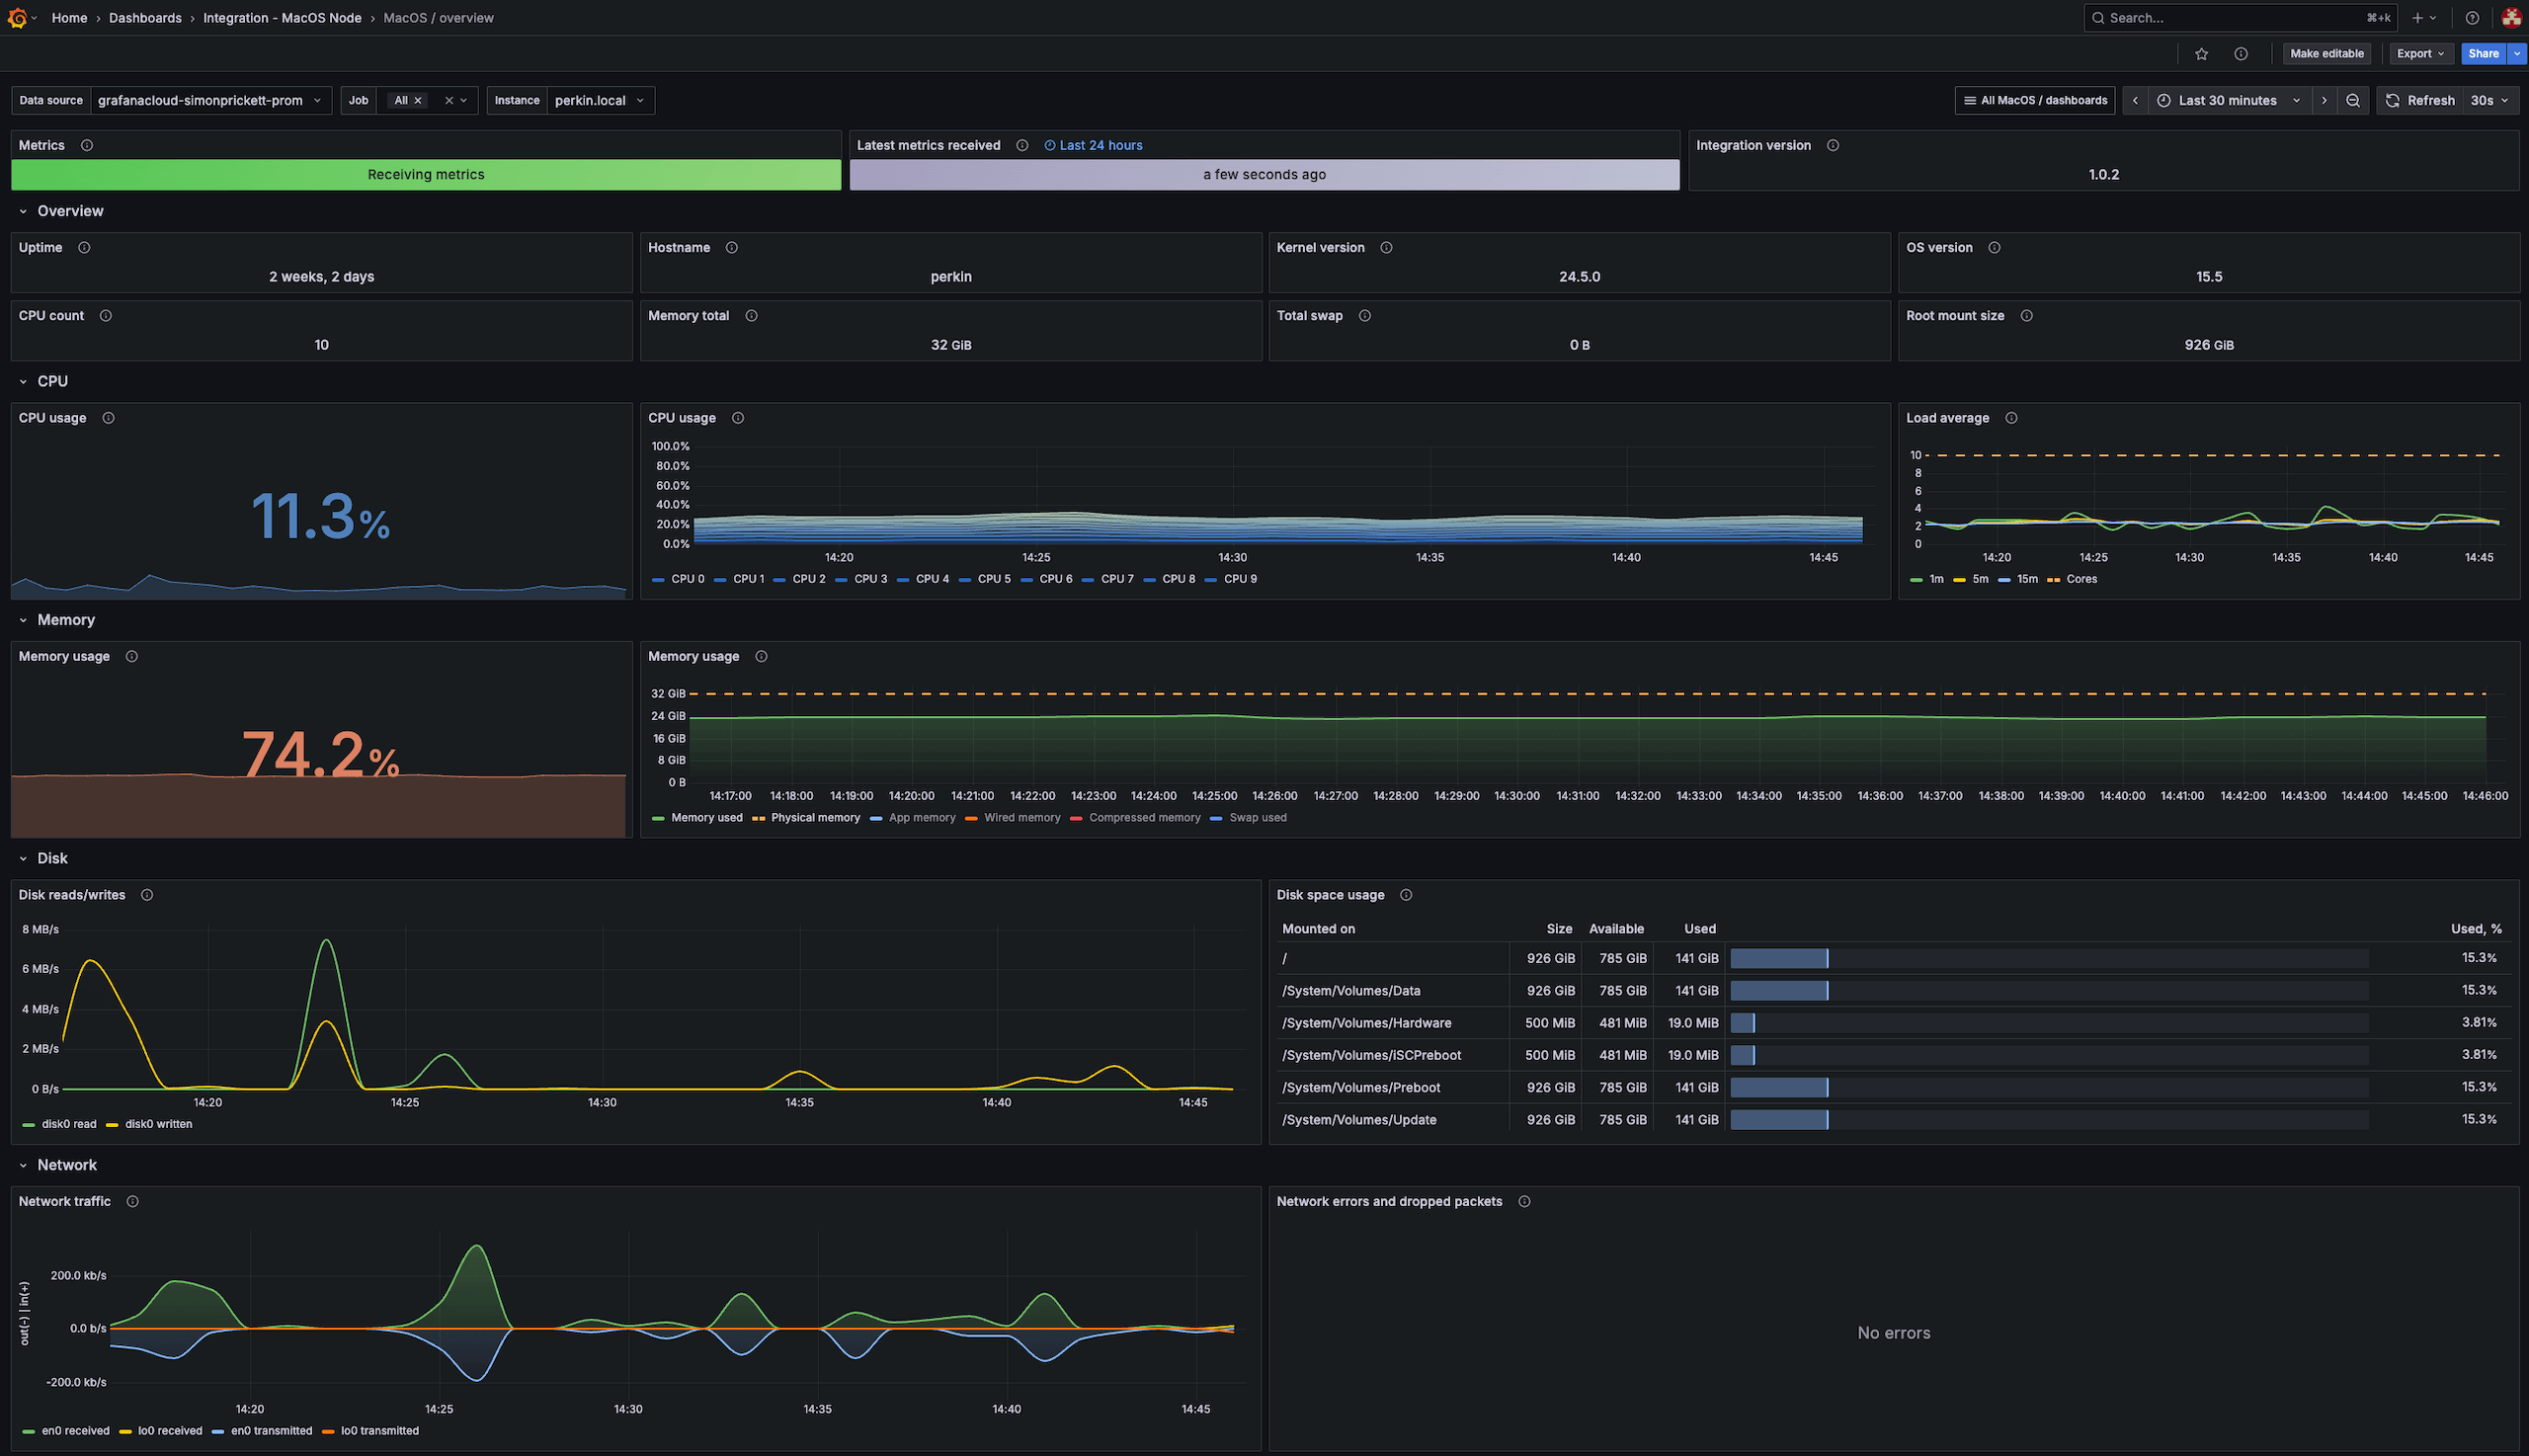
This dashboard offers a comprehensive overview of the system, including:
- Metadata: Displays information such as the kernel version, OS release, uptime, and more.
- CPU utilization: Displays the current usage of the CPU.
- Memory utilization: Shows how much memory is being used.
- Disk utilization: Indicates the usage level of disk space.
- Network utilization: Provides information about network usage.
Use this dashboard to:
- Gain a high-level understanding of the operational status of your system.
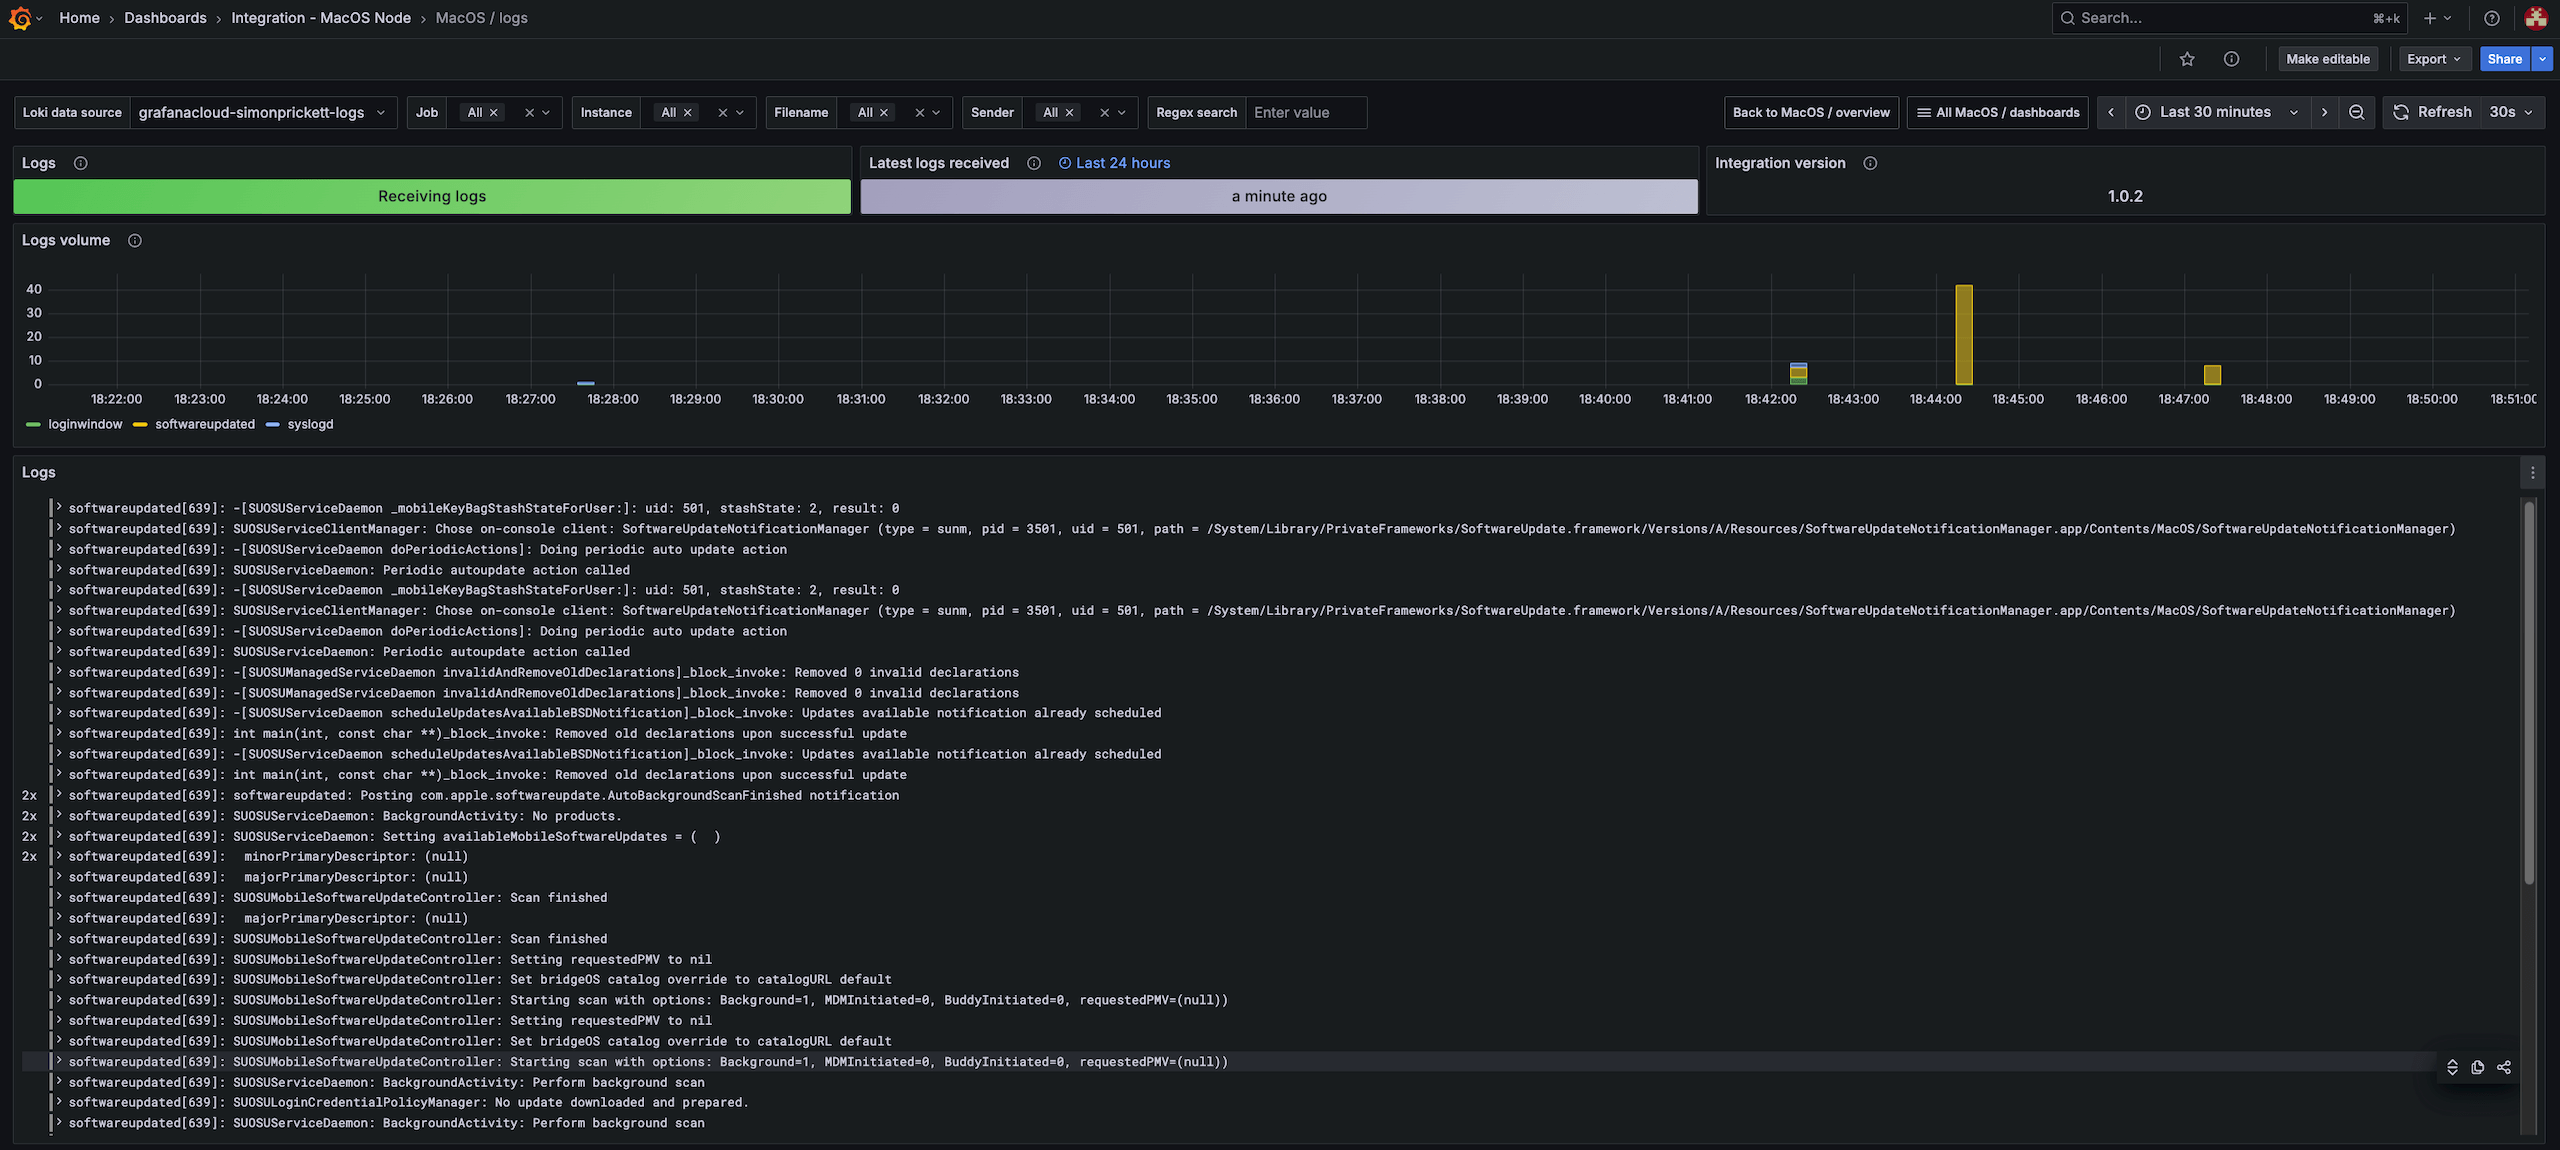
This dashboard provides an overview of logs gathered from the system, including the following:
- Metadata, such as the integration version and data retrieval status
- Performance metrics showing the volume of logs received
- An interactive view of the log entries themselves
Use this dashboard to:
- Check that logs are being received in a timely fashion
- Read and explore log entries
Troubleshooting options
At this point in your journey, you can explore the following paths:
Grafana fundamentals (tutorial)
5 quick ways to uplevel your use of Grafana (conference lightning talk)