
Monitor a macOS system in Grafana Cloud
Welcome to this Grafana learning journey that shows you how to monitor your macOS system.
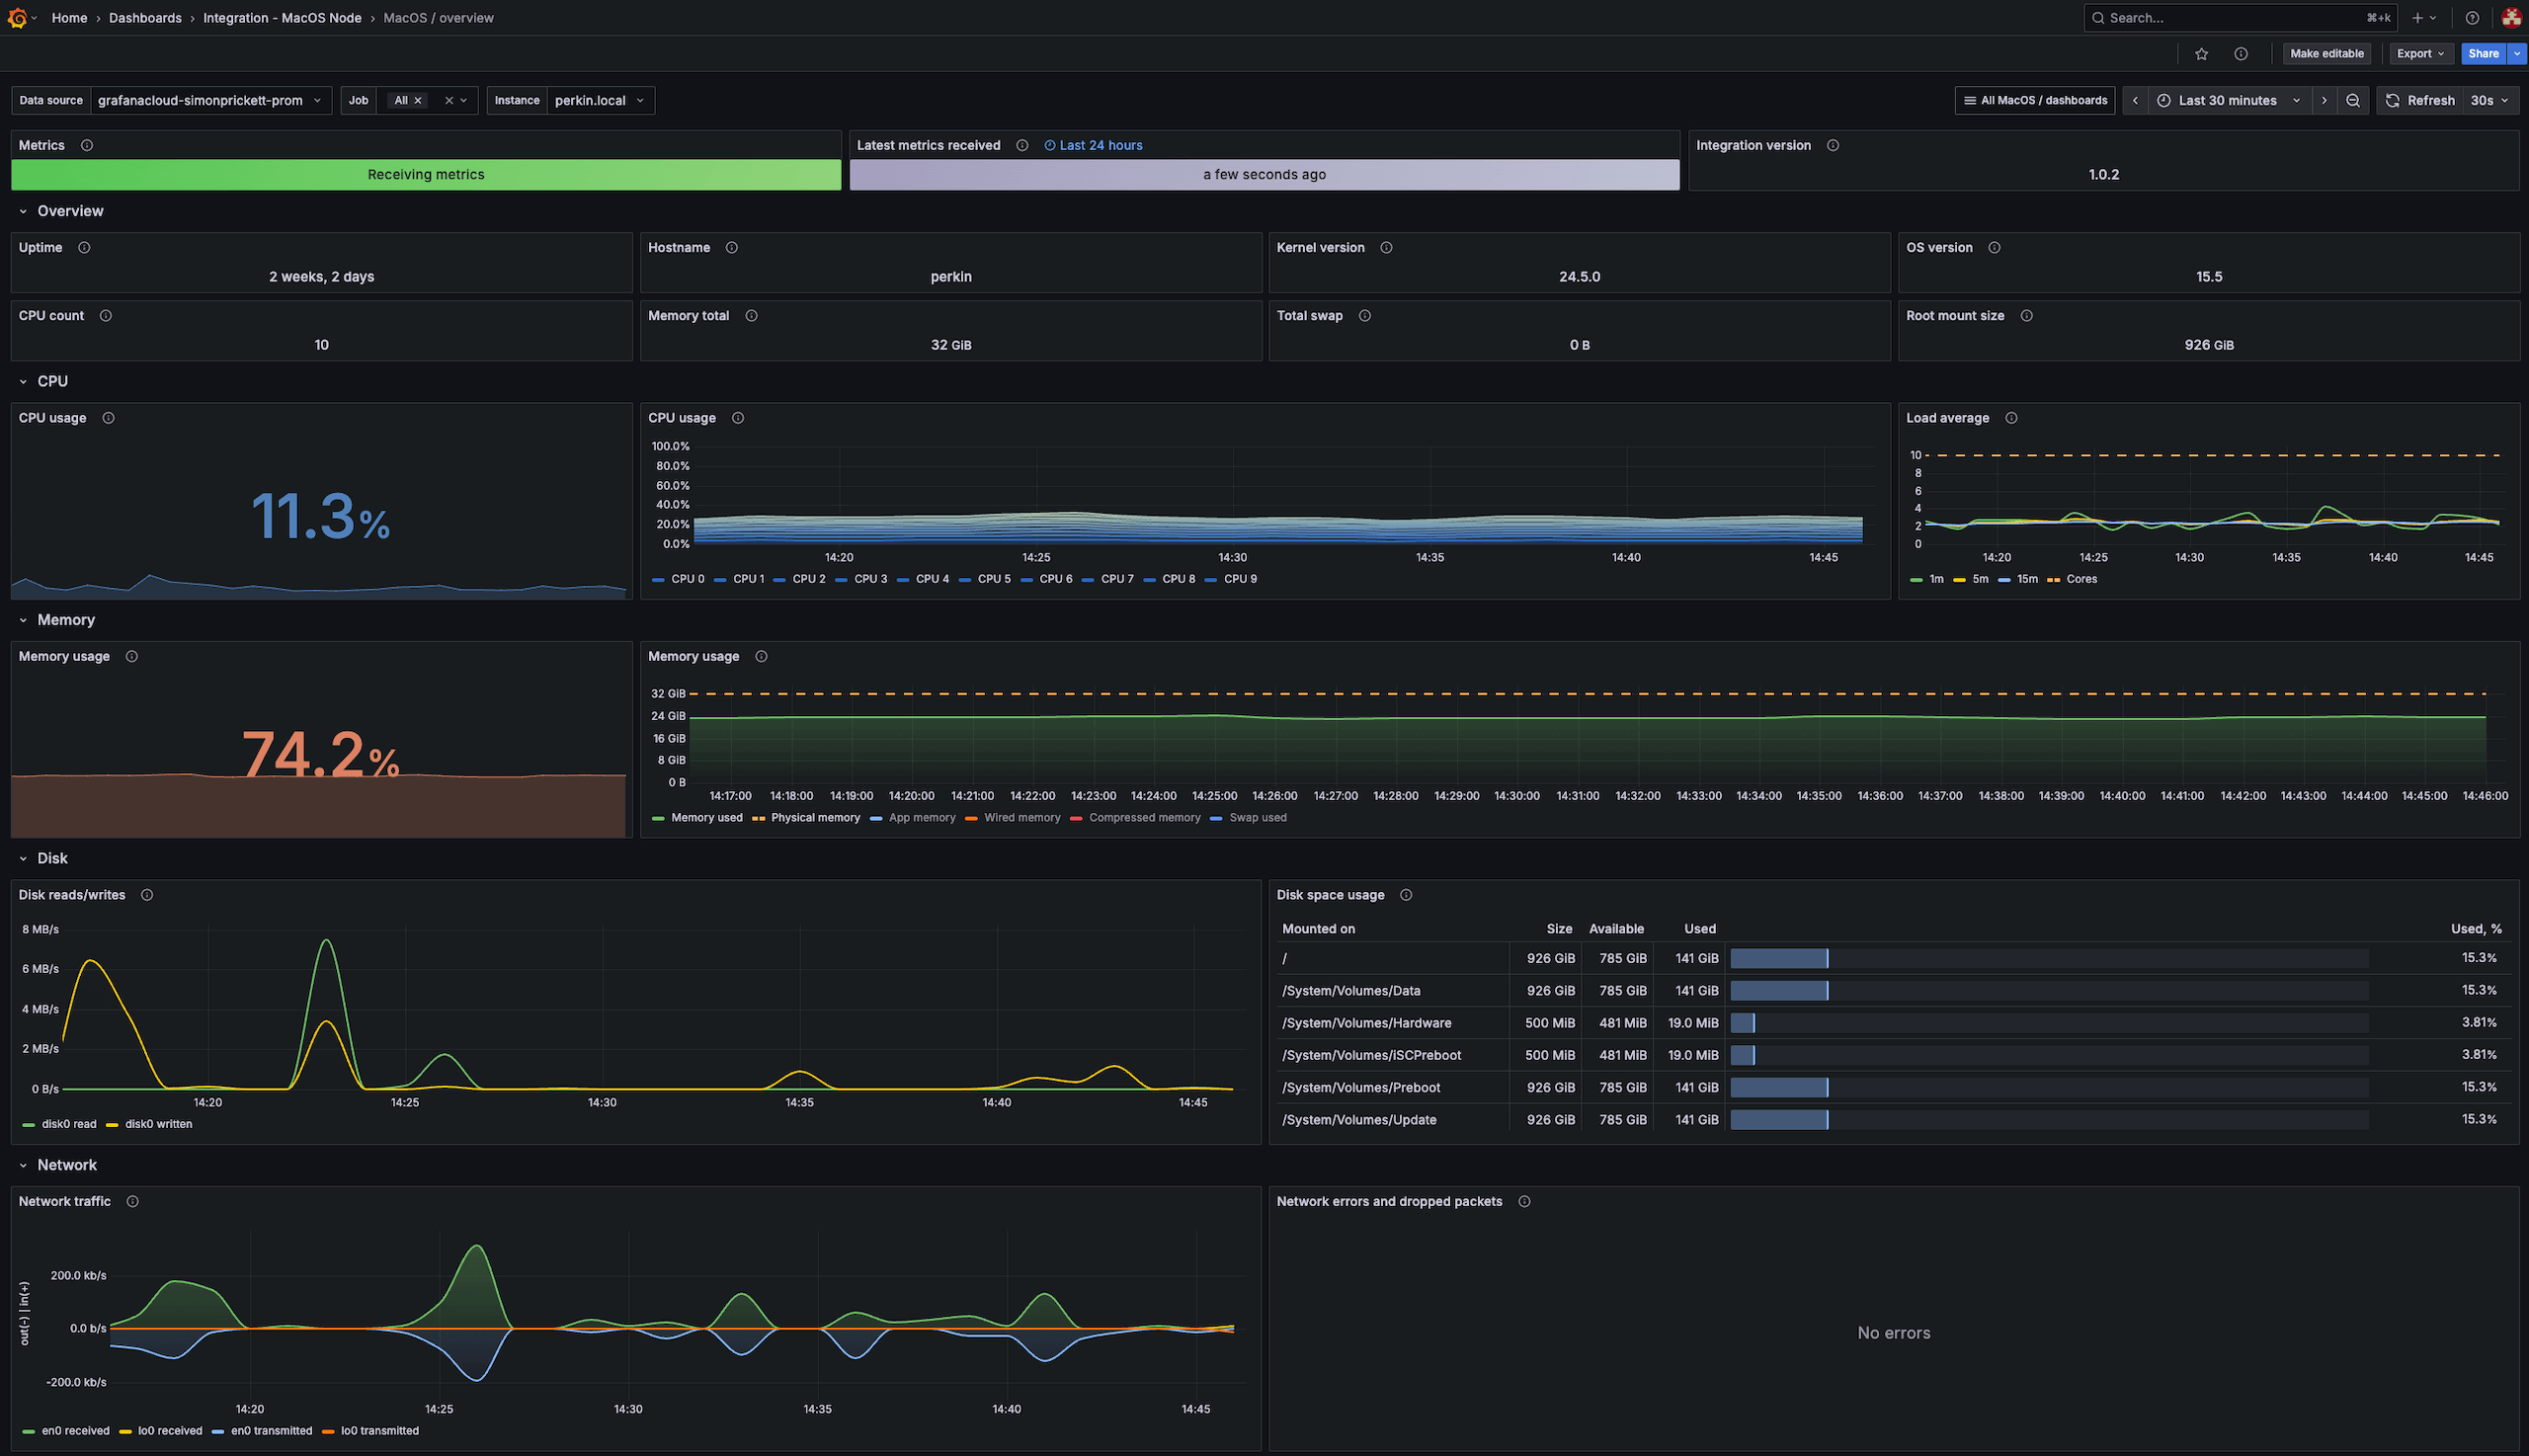
This journey involves implementing an integration that provides helpful alerts and pre-built dashboards to monitor metrics and logs for macOS systems. Grafana’s macOS integration collects metrics related to the operating system, including aspects such as CPU usage, load average, memory usage and disk and networking I/O.
When you complete this journey, you’ll be able to:
- Describe the benefits of using Grafana Cloud as your observability solution
- Set up a macOS integration and view telemetry data from your macOS system
- Use pre-built dashboards and alerts to identify and troubleshoot problems in your environment
Troubleshooting
If you get stuck, we’ve got your back! Where appropriate, troubleshooting information is just a click away.
More to explore
We understand you might want to explore other capabilities not strictly on this path. We’ll provide you opportunities where it makes sense.
Before you begin
Before you begin installing an integration, ensure you have:
- A Grafana Cloud account. To create an account, see Grafana Cloud.
- A machine running Linux (or the OS of the integration you’re installing).
- Command line (terminal) access to the machine.
- Admin access to the machine on which you are installing the integration.