Explore logs using Logs Drilldown
Welcome to the Explore logs using Logs Drilldown learning journey. Grafana Logs Drilldown is a feature designed to simplify log exploration by providing an intuitive, query-less interface. It enables you to automatically visualize and explore logs without the need of writing LogQL queries, making it accessible to engineers of all levels.
Logs Drilldown is a feature exclusive to Grafana Loki. Loki is a horizontally-scalable, highly-available, multi-tenant log aggregation system inspired by Prometheus. Loki differs from Prometheus by focusing on logs instead of metrics, and collecting logs via push, instead of pull.
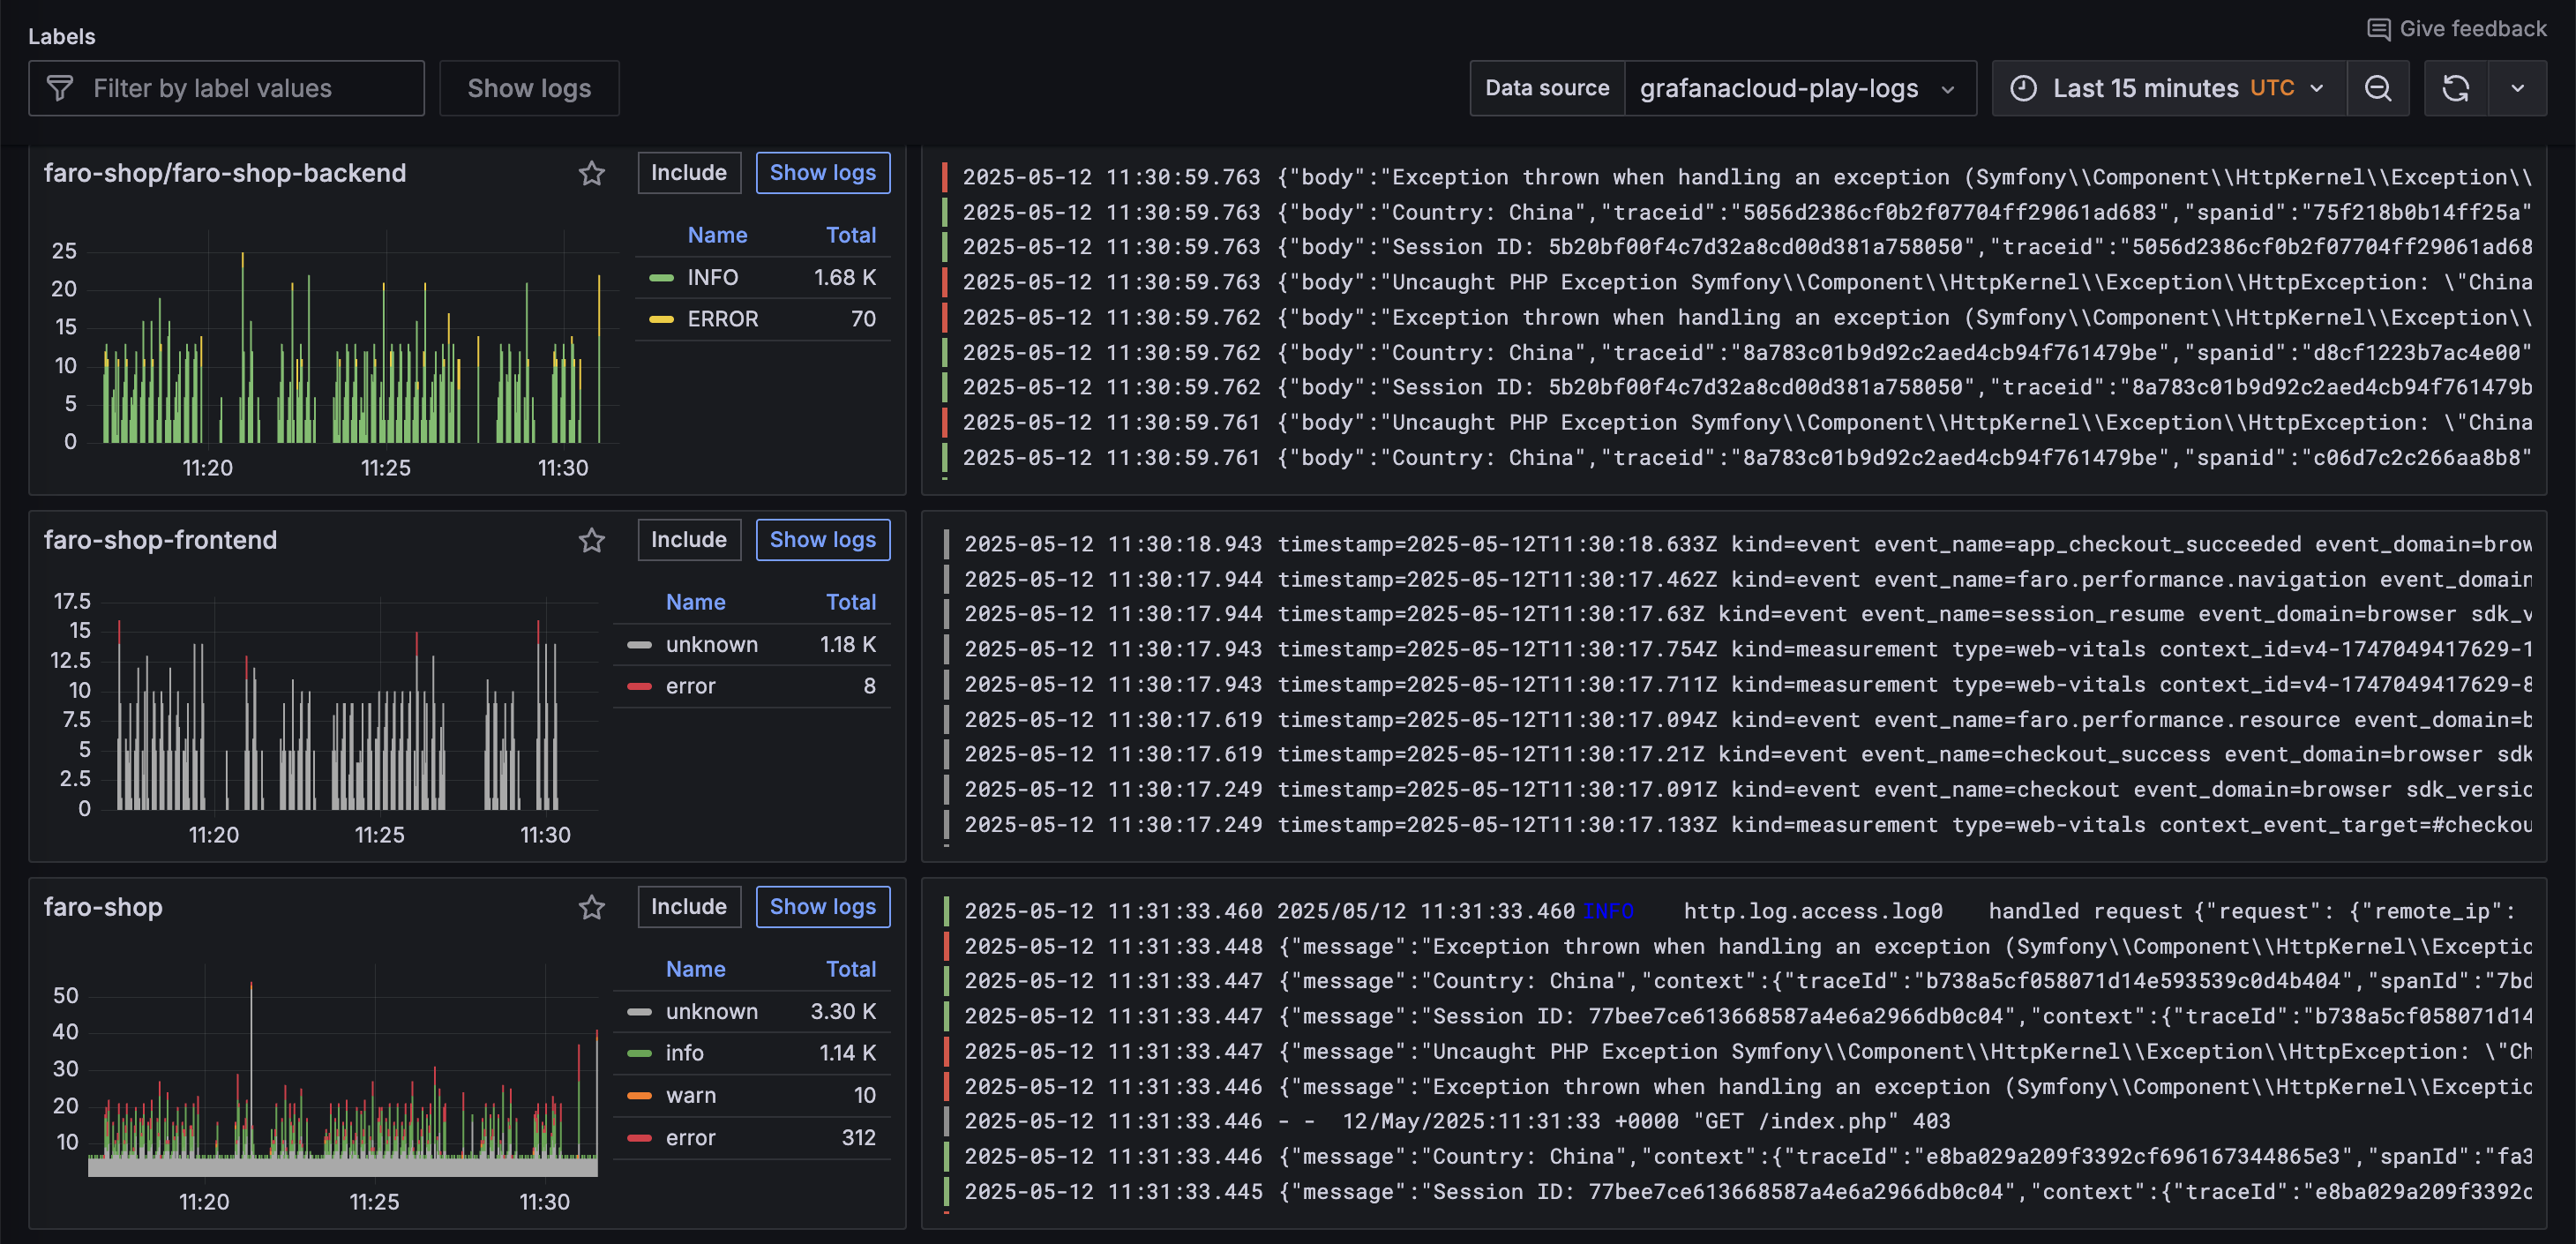
The Logs Drilldown image below shows logs from various applications exported to Grafana Cloud.
When you complete this journey, you’ll be able to:
- Navigate to Logs Drilldown
- Search for and filter specific logs you want to investigate
- Learn how to drill down into a log and investigate related logs
- Add a log visualization to a dashboard
Troubleshooting
If you get stuck, we’ve got your back! Where appropriate, troubleshooting information is just a click away.
More to explore
We understand you might want to explore other capabilities not strictly on this path. We’ll provide you opportunities where it makes sense.
Before you begin
Before you use Logs Drilldown, ensure that you have:
- A Grafana Cloud account. To create an account, refer to Grafana Cloud.
- Basic familiarity with Grafana Loki.
- Loki up and running and connected as a data source, whether it’s locally installed or using Grafana Cloud Logs, provided by Grafana Cloud.
- Logs ingested into Loki using agents such as Grafana Alloy, OpenTelemetry Collector, or other third-party clients.
- A familiarity with the logs you plan to examine. Understanding what these logs mean will help you troubleshoot issues quickly by spotting anomalies or errors.