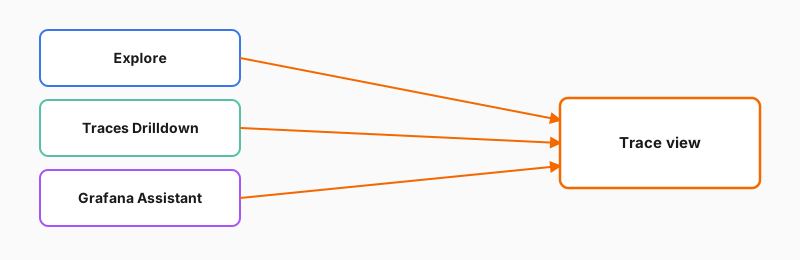
One trace view, several ways to open it
By the end of the pipeline, your traces are stored and ready to open. But a stored trace only pays off once you can read it, and that’s the one skill the pipeline can’t hand you. Grafana can show a trace from more than one place, which is exactly what makes newcomers hesitate: pick one and you assume you’ve learned the wrong thing. You haven’t. They all open the same screen.
That screen is the trace view: the Grafana screen that shows a single trace. It lays the trace out as a timeline where each span is a row, stacked by when it started and nested under the span that triggered it, so you can see at a glance where the time went. That timeline is the span waterfall. Learn to read it once and the skill carries to every surface that shows a trace.
Where you open a trace
- Explore: Grafana’s general-purpose screen for ad-hoc queries. It’s the traditional, universal way to open a trace.
- Traces Drilldown: a visual way to explore traces without writing a query, so you can open a trace without a query box.
Both open the same trace view. You can also ask Grafana Assistant, Grafana’s built-in AI helper, to pull one up for you, for example “show me a slow checkout trace from the last hour”.
Whichever one you pick, you land in the same place: