The four-stage tracing pipeline
Tracing isn’t a single product. Getting a trace from your application onto your screen takes several separate pieces: one produces the spans, one moves them, one stores them, and one reads them. Out of context, their names blur together.
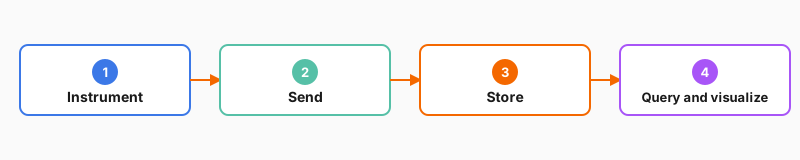
This section is the map that puts those pieces in order. Every trace follows the same path, from your application to your screen. That path, from producing a trace to reading it, is the tracing pipeline, and it has four stages:
- Instrument: your application produces spans as it handles a request.
- Send: those spans travel from your application to where they’re stored.
- Store: the spans are saved together as a trace so you can find them later.
- Query and visualize: you find a trace and read it to see where the request spent its time.
Each of these steps is one pipeline stage: one link in the path a trace takes.
The four stages run in order, each handing the trace to the next:
One tool per stage
The next three slides walk the first three stages in order and introduce the main tool at each one. The fourth stage, finding and reading a trace, is where the rest of the journey is headed: you’ll do it hands-on in the next section.