InfluxDB to Grafana Cloud
For InfluxDB metrics, you can use either the InfluxDB exporter or Telegraf as a bridge to Grafana Cloud. Teams with existing InfluxDB infrastructure use these to send their metrics.
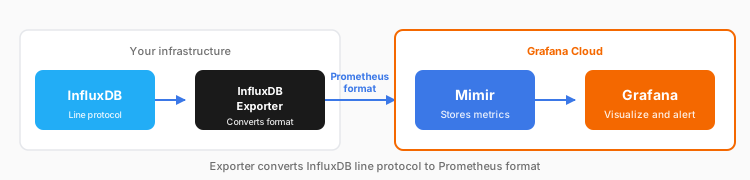
Option 1: InfluxDB exporter
Best when you want to keep existing InfluxDB writers unchanged.
- No changes to your InfluxDB writers, and it accepts InfluxDB line protocol.
- Converts the line protocol to Prometheus format and exposes it on a scrape endpoint. Prometheus scrapes the exporter and remote writes the metrics to Grafana Cloud.
- Adds two components to run and maintain: the exporter and Prometheus.
Option 2: Telegraf
Best when you want a direct push model.
- Pushes line protocol directly with Telegraf’s InfluxDB output plugin to the Grafana Cloud metrics endpoint, which converts it to Prometheus format. A Prometheus remote write output is also supported.
- Adds Telegraf as a tool to manage in your setup.