InfluxDB
Grafana Cloud can store InfluxDB line protocol in Grafana Cloud Metrics in two ways. A third option, the InfluxDB data source, queries InfluxDB where it already lives and does not store a copy.
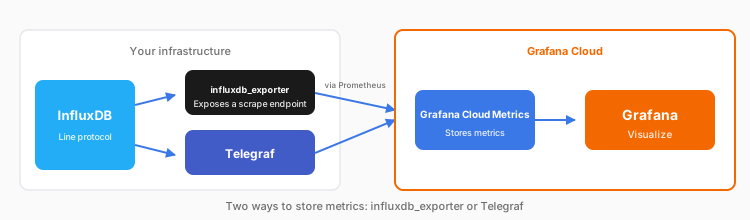
Option 1: influxdb_exporter
Use this when you want Prometheus to scrape InfluxDB metrics and remote-write them.
- Install
influxdb_exporteron the system where InfluxDB runs. It exposes an endpoint Prometheus can scrape. - Prometheus scrapes that endpoint and sends the samples with
remote_write. - You run both the exporter and Prometheus.
Option 2: Telegraf
Use this when Telegraf, or another client, already pushes Influx line protocol.
- Point Telegraf’s InfluxDB output at your metrics write endpoint plus
/api/v1/push/influx. - Grafana Cloud converts each line-protocol field into a Prometheus series named
metric_name_field. - Set
skip_database_creation = true. The Grafana Cloud Influx write endpoint does not support creating databases, and Telegraf tries to create one by default.