Ways to send metrics and logs
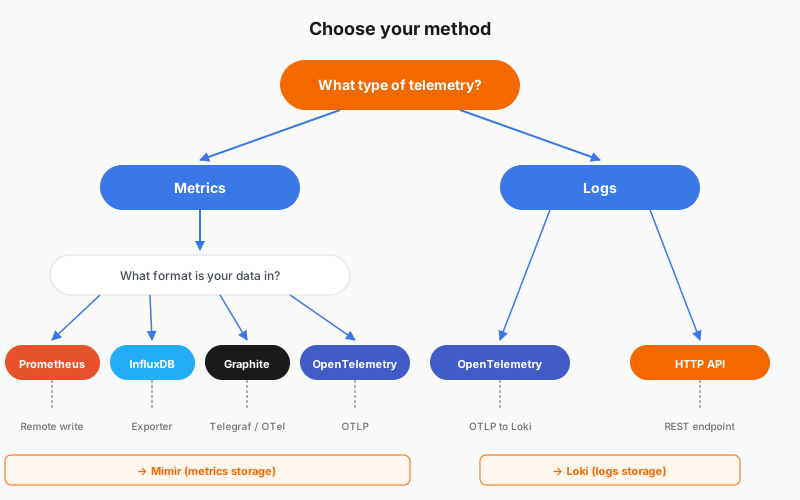
There’s a method of sending data to Grafana Cloud for each source. Which one you use depends on your telemetry type and the format your data is already in. This diagram maps each source to its method and destination.
Metrics
Four sources, each with its own method or two, depending on the format your data is in.
- Prometheus: use Prometheus remote write, built into Prometheus.
- InfluxDB: use the InfluxDB exporter or Telegraf to convert your metrics to Prometheus format.
- Graphite: stream directly with carbon-relay-ng, or use the hosted Graphite HTTP API.
- OpenTelemetry: send through the OTLP endpoint.
Logs
Two methods, depending on your tools.
- OpenTelemetry: use the OTLP endpoint if your applications or collectors already support OTLP.
- HTTP API: use it from any tool that can make HTTP requests.