Ways to send metrics and logs
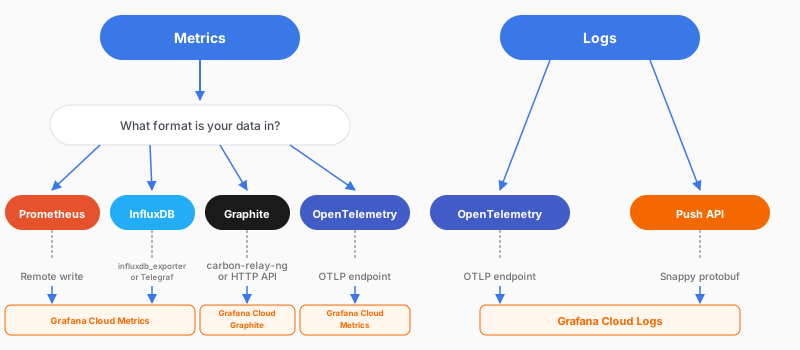
The method depends on whether you are sending metrics or logs, and on the format you already have. Prometheus, InfluxDB, and OpenTelemetry metrics are stored in Grafana Cloud Metrics. Graphite metrics are stored in the Graphite backend in your stack, not in Grafana Cloud Metrics.
Metrics
- Prometheus: Prometheus
remote_writepushes scraped samples to Grafana Cloud Metrics. - InfluxDB: the
influxdb_exporterexposes metrics for Prometheus to scrape and remote-write, or Telegraf pushes them. Telegraf is a client that sends Influx line protocol, the text format InfluxDB uses for metrics. - Graphite: carbon-relay-ng accepts plain-text carbon metrics and forwards them to Grafana Cloud Graphite. You can also send to the hosted Graphite HTTP API. Both land in Grafana Cloud Graphite.
- OpenTelemetry: the Grafana Cloud OTLP endpoint accepts OTLP metrics and routes them into Grafana Cloud Metrics.
Grafana Cloud also documents sending Datadog metrics. This journey does not walk through that method.
Logs
- OpenTelemetry: the same OTLP endpoint accepts OTLP logs and routes them into Grafana Cloud Logs.
- Push API: Grafana Cloud Logs is powered by Loki. Log entries are ingested with
POST /loki/api/v1/push.