Read transcript
Audio transcript
API calls, alerts, and configuration errors tell you if your collector is operational, but they’re not the only ways to monitor your collectors.
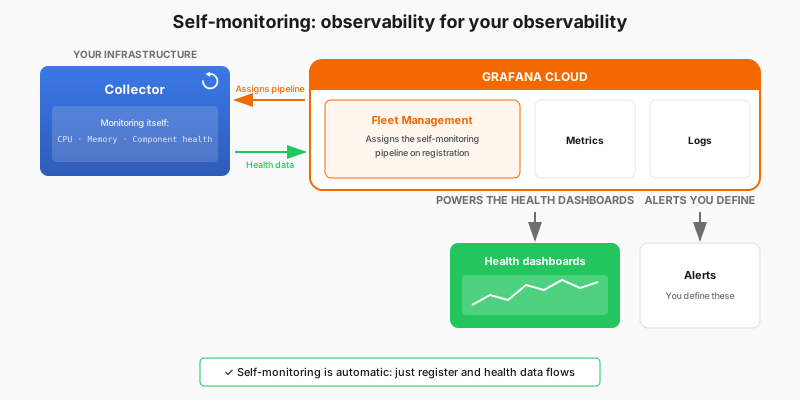
Self-monitoring pipelines are configuration that Fleet Management automatically assigns to each collector. They tell the collector to monitor itself, collecting its own CPU usage, memory consumption, component health, and internal logs, and to send that data to Grafana Cloud.
Here’s why this matters. Imagine your collector is running on a server, collecting metrics from your applications. But what if the collector itself starts having problems? Maybe it’s running out of memory, or a component is failing. Without some way to monitor the collector itself, you’d have a blind spot. You wouldn’t know there was a problem until your metrics stopped showing up.
Self-monitoring pipelines eliminate that blind spot. When you register a collector with Fleet Management, these pipelines get assigned automatically. The collector immediately starts collecting its own health data and sending it to Grafana Cloud. That data powers the health dashboards you see in Fleet Management.
Here’s the key point: you don’t have to configure anything. Self-monitoring happens automatically when you register a collector. The health data just starts flowing.
Now it’s time to put these concepts into practice. In the next slide, you’ll complete a hands-on path where you’ll register a collector with Fleet Management and explore the health monitoring features firsthand.