How it works
Collectors register with Fleet Management, receive remote configurations, and send health telemetry back to Grafana Cloud.
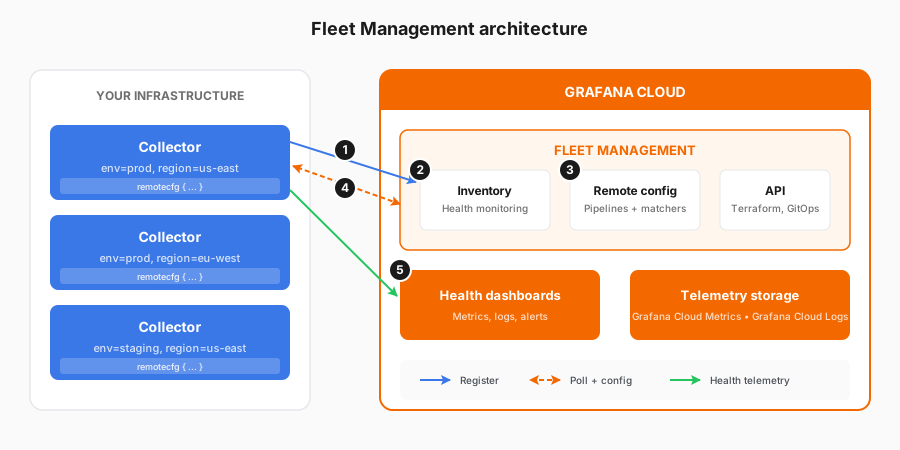
The flow
- Register: The collector registers itself with Fleet Management, declaring its identity, its attributes, and that it’s ready to receive remote configuration.
- Discover: Each collector appears in the Fleet Management inventory, where you can see its health status, version, operating system, and the attributes you’ve assigned, such as
env,region, orteam. - Configure: You create configuration pipelines and assign them to collectors with attribute matching, for example, every collector where
env=production. - Distribute: Collectors poll the Fleet Management API for matching configurations.
- Monitor: Collector health telemetry flows back to Fleet Management dashboards.
Key concepts
Local + remote configs
Grafana Alloy runs local and remote configurations in parallel, isolated from each other. This means:
- Remote config errors don’t break local config.
- You can mix and match based on your needs.
- Gradual migration from local to remote is safe.
The OpenTelemetry Collector works differently. Its Supervisor merges local and remote configuration and doesn’t automatically roll back to the last working remote config, so validate remote changes carefully when using it.