How the data flows
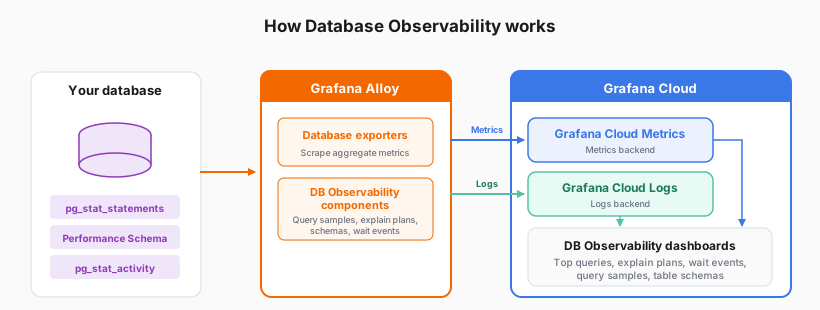
Grafana Alloy runs alongside your database and reads its built-in statistics. Where those statistics come from depends on the database:
- PostgreSQL:
pg_stat_statementsfor aggregate query statistics andpg_stat_activityfor active sessions. Thepg_stat_statementsextension must be installed and enabled. - MySQL: Performance Schema, which is enabled by default in MySQL 8.0 and later
Alloy splits that data into two streams and forwards each to a different Grafana Cloud backend:
- Metrics (query counts, latency, errors, and resource usage) are scraped by database exporters and sent to Grafana Cloud Metrics.
- Logs (query samples, explain plans, schema details, and wait events) are collected by the Database Observability components and sent to Grafana Cloud Logs.
Grafana Cloud provides Database Observability dashboards that bring the metrics and logs together into a single view of query performance, starting with the Queries Overview dashboard.
Database Observability is designed to minimize impact on your production databases. To capture an explain plan, it runs
EXPLAIN, notEXPLAIN ANALYZE, so the query itself does not run. That has minimal overhead for most queries.
When you collect more than you need
Query samples, schema details, and wait events are sent to Grafana Cloud Logs along with the metrics. If that is more than you need, Requirements and overhead lists three changes:
- Raise
collect_interval, for example from 1 minute to 5 minutes. - Lower
explain_plans.per_collect_ratio, for example to0.5or lower. - Exclude schemas you don’t need (
exclude_schemason MySQL) or databases you don’t need (exclude_databaseson PostgreSQL).
Tune Alloy collection has a high-volume example of those same settings.