Slide 1 of 11

Browse the data sources

Browse the data sources

Grafana supports more than 150 data sources, but you don’t need to learn them all. This journey covers some common ones.
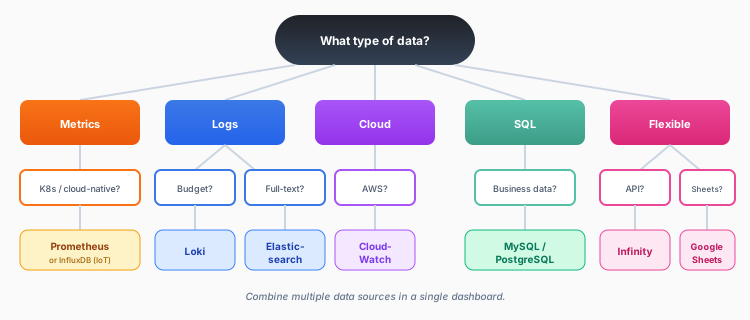
Data source decision flowchart: start with data type, then narrow by use case

Here are the data sources you can explore in this course.

Data sourceTypeBest forQuery language
PrometheusMetricsCloud-native metricsPromQL
InfluxDBMetricsIoT, high-volumeFlux, InfluxQL, SQL (v3+)
LokiLogsCost-effective logsLogQL
ElasticsearchLogsFull-text searchLucene
CloudWatchCloudAWS resourcesMetrics Insights, metric math
MySQLSQLApplication dataSQL
PostgreSQLSQLApplication dataSQL
InfinityFlexibleAPIs, filesJSONata, JQ, UQL
Google SheetsFlexibleSpreadsheet dataCell references

A Grafana Cloud account is helpful for hands-on practice, but optional. You can read through this journey to understand the setup process without connecting anything yourself.

Script

You’ve learned what data sources are and the two ways to work with your data. Great foundation.

Grafana supports more than 150 data sources, but you don’t need to learn them all. This journey covers some common ones, grouped by what they store: metrics systems like Prometheus and InfluxDB, log systems like Loki and Elasticsearch, cloud providers like CloudWatch, SQL databases like MySQL and PostgreSQL, and flexible options like Infinity and Google Sheets.

These are some of the common data sources you can explore in this course.