Slide 3 of 4

What are data sources?

A connection to where your data lives

A data source is a connection to a backend that holds your data, such as a Prometheus server, a Loki instance, a SQL database, or a cloud monitoring service. Every data source:

  • Comes from a data source plugin, the connector software. Common ones are built in; for others you install the plugin first.
  • Is the configured instance you add from that plugin, with its own connection details. You install a plugin, but you configure a data source.
  • Comes with a query editor that formulates queries in the source’s own language
  • Lets you query, visualize, and alert on your data without moving it

Your data already lives across systems like these. Grafana connects to them as data sources without custom integration code or a separate data pipeline, querying each one through its API instead of collecting your data with an agent. Your data stays where it lives, with no migration.
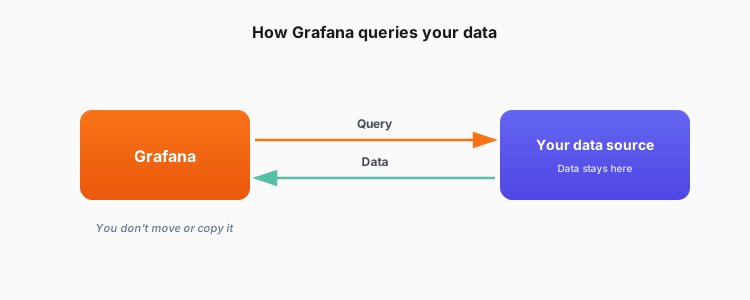
Grafana sends a query to your data source and the data comes back. Your data stays in its original system.

What connecting gives you

With that connection, you can:

CapabilityWhat it means
QueryRun queries against your data from Grafana, using each source’s query language.
VisualizeBuild dashboards and panels from those queries.
AlertCreate alert rules that watch your data and notify you. A single alert rule can query more than one data source, for example a Prometheus error rate alongside an Elasticsearch log query.

You can also combine multiple data sources in a single dashboard, for example Prometheus metrics alongside MySQL application data and CloudWatch stats.

Script

Here’s something fundamental to understand about data sources: when you use them, your data stays where it lives. Grafana Cloud can store data through integrations or when you send telemetry directly, but data sources are different. They’re connections to external systems where your data already lives.

A data source is a connection to an external system like a database, a metrics store, a cloud service, or an API. When you add a panel to a dashboard, you’re really saying “go to this data source, run this query, and show me the results.”

With that connection, you can do three things: query your data, visualize it in dashboards, and alert on it. You can also use multiple data sources in the same dashboard. Prometheus metrics alongside MySQL application data alongside CloudWatch AWS stats.

Different sources, one unified view.