Slide 6 of 8

GCP Cloud Logging data source

How it works

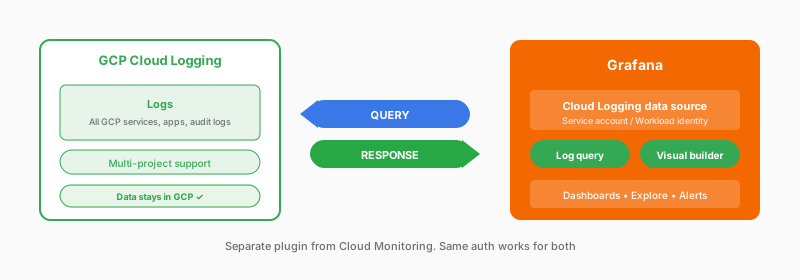
GCP Cloud Logging data source: Query GCP logs directly from Grafana

Authenticate with a service account JSON key, or use workload identity when you run Grafana in GKE. You write queries in Cloud Logging’s query language, and a visual query builder helps if you’re not familiar with the syntax. GCP uses two separate data sources. Configure Cloud Monitoring for metrics and Cloud Logging for logs, and the same authentication works for both.

What you get

  • All GCP service logs
  • Visual query builder
  • Filter by resource, severity
  • Template variables
  • Log context and details

Considerations

  • Cloud Logging query syntax
  • API latency
  • Separate from metrics data source
  • Per-project authentication, typically
  • Alert evaluation calls the API

Authentication options

Service account JSON key or workload identity (same as Cloud Monitoring)

Documentation

View the Cloud Logging data source documentation.

Script

For GCP logs, there’s a separate data source, Google Cloud Logging. This connects directly to Cloud Logging, letting you query logs from all your GCP services without storing them in Grafana Cloud Logs.

Authentication works the same as Cloud Monitoring: a service account JSON key or workload identity if you’re running in GKE.

You write queries using Cloud Logging’s query language, which is similar to what you’d use in the GCP console. Filter by resource type, severity, timestamp, or any log field. The visual query builder helps if you’re not familiar with the syntax.

One thing to note: unlike AWS and Azure where one plugin handles both metrics and logs, GCP requires two separate data sources. You’ll configure Cloud Monitoring for metrics and Cloud Logging for logs.

The same authentication can work for both. Just grant your service account the appropriate roles.