Slide 5 of 8

GCP Cloud Monitoring data source

How it works

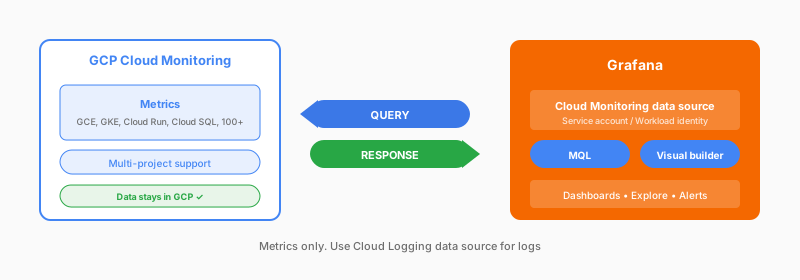
GCP Cloud Monitoring data source: Query GCP metrics directly from Grafana

Authenticate with a service account JSON key, or use workload identity when you run Grafana in GKE. The plugin supports PromQL, Monitoring Query Language (MQL), and a visual query builder. For multi-project setups, grant your service account permissions across the projects and query them all from one Grafana instance.

What you get

  • All GCP service metrics
  • PromQL, MQL, and visual builder query modes
  • Alignment and aggregation
  • Template variables
  • Label filtering

Considerations

  • API latency
  • Per-project authentication, typically
  • Alert evaluation calls the API

Authentication options

Service account JSON key or workload identity

Documentation

View the Cloud Monitoring data source documentation.

Script

For GCP, the Cloud Monitoring data source connects you to all the metrics Google collects. Authenticate with a service account JSON key, or if you’re running Grafana in GKE, use workload identity.

The plugin supports PromQL, Monitoring Query Language (MQL), and a visual query builder. Through the builder, you can filter by resource type, select metrics, and choose alignment and aggregation using dropdown menus.

For multi-project setups, grant your service account permissions across projects, and you can query them all from one Grafana instance.

A few things to know: API latency and alert evaluations calling the API.

But if GCP is your primary cloud and you want direct access to Cloud Monitoring data, this gives you exactly that.