Slide 4 of 8

Azure Monitor data source

How it works

Azure Monitor data source: Query metrics, Log Analytics, and App Insights from Grafana

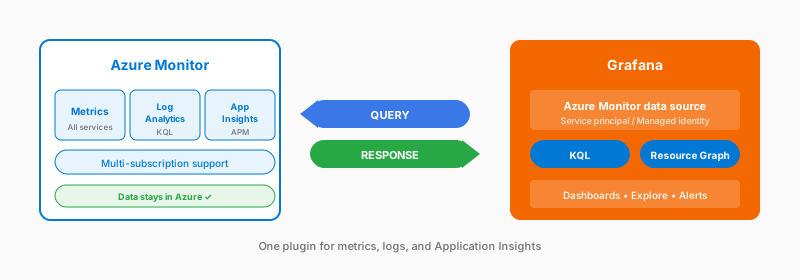
One plugin gives you Azure metrics, Log Analytics workspaces, Application Insights, and Azure Resource Graph. Authenticate with a service principal, a managed identity when you run Grafana in Azure, or a Microsoft Entra ID app registration. Logs use KQL. Multi-subscription support lets you build dashboards that span your Azure estate.

What you get

  • Metrics and Log Analytics in one plugin
  • Application Insights integration
  • Resource graph for discovery
  • Multi-subscription support
  • Template variables

Considerations

  • KQL query learning curve
  • Azure API latency
  • Alert evaluation calls the API

Authentication options

Service principal, managed identity, or Microsoft Entra ID app registration

Documentation

View the Azure Monitor data source documentation.

Script

The Azure Monitor data source is impressively comprehensive. One plugin gives you access to Azure metrics, Log Analytics workspaces, Application Insights, and even Azure Resource Graph for resource discovery.

You authenticate with a service principal, a managed identity if you’re running Grafana in Azure, or a Microsoft Entra ID app registration.

The query language for logs is KQL, Kusto Query Language. If you’ve never used it, there’s a learning curve. But KQL is genuinely powerful once you get the hang of it. Great for log analysis, aggregations, and joins.

Multi-subscription support means you can build dashboards that span your entire Azure estate.

A few things to know: API calls on every refresh, KQL as the query language, and alert evaluations hitting the API.

But if your team lives in Azure and already knows KQL, this might be exactly what you need.