Slide 3 of 8

AWS CloudWatch data source

How it works

AWS CloudWatch data source: Query CloudWatch metrics and logs directly from Grafana

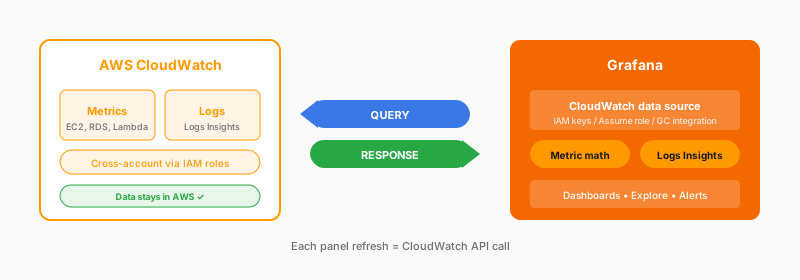
Provide IAM credentials: access keys, an assumed role, or the built-in AWS integration when you run Grafana Cloud. Once connected, you can query both metrics and logs. Build a dashboard that shows EC2 CPU, Lambda invocations, and RDS connections together, all pulling live from CloudWatch. Cross-account access works through IAM role assumption, so you can see data from multiple AWS accounts in one dashboard.

What you get

  • Metrics and logs in one source
  • Cross-account and cross-region
  • Metric math and statistics
  • Template variables
  • Logs Insights queries

Considerations

  • CloudWatch API costs per query
  • CloudWatch query language
  • API latency affects dashboards
  • Rate limits with many panels
  • Alert evaluation calls the API

Authentication options

IAM access keys, assume role, or Grafana Cloud AWS integration

Documentation

View the CloudWatch data source documentation.

Script

The CloudWatch data source is Grafana’s direct connection to AWS. You provide IAM credentials: access keys, an assumed role, or if you’re running in Grafana Cloud, you can use the built-in AWS integration.

Once connected, you can query both metrics and logs. Build a dashboard showing EC2 CPU alongside Lambda invocations alongside RDS connections, all pulling live from CloudWatch.

Cross-account access works through IAM role assumption, so you can see data from multiple AWS accounts in one dashboard.

There are a few things to know. Every time a panel refreshes, that’s a CloudWatch API call. Ten panels refreshing every 30 seconds means hundreds of API calls per hour.

That costs money and can hit rate limits.

And you’re writing queries in CloudWatch’s syntax: metric math, statistics, and Logs Insights.

When you’d rather query in place than add ingestion and storage, this gives you full dashboards, alerting, and correlation straight from CloudWatch.