Audio transcript
Everything we covered in the metrics and logs sections, collecting metrics and logs and storing them in Grafana Cloud, is the Cloud Provider Observability product.
What we’re covering now is different. Data source plugins are a core Grafana capability that exists in every edition: open source Grafana, Grafana Enterprise, and Grafana Cloud. They’re not part of Cloud Provider Observability, but we cover them here because they offer a legitimate alternative path.
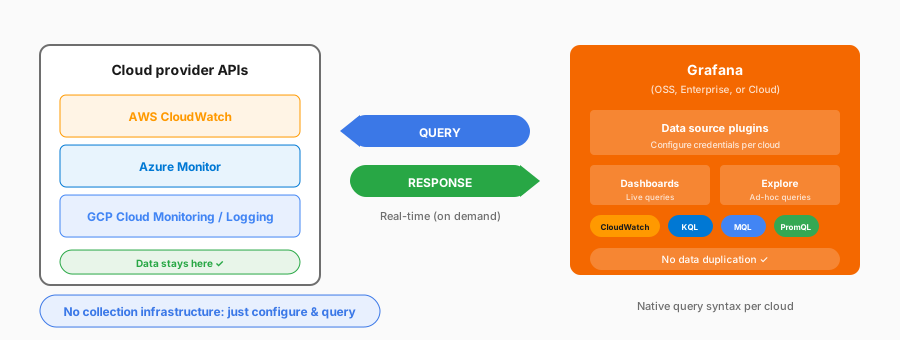
So how does this work? You configure credentials for your cloud provider. When you open a dashboard, Grafana calls the CloudWatch API, the Azure Monitor API, or the Cloud Monitoring API in real-time.
The data never leaves your cloud provider. Grafana just fetches what you need for the current view.
The appeal is simplicity. No collection infrastructure, no storage costs, no data duplication.
A few things to know: query performance depends on the cloud API, you use the cloud’s own query language such as CloudWatch’s syntax or Azure’s KQL, and alerting makes an API call for every evaluation, which can add up.
This approach fits when you want to avoid extra ingestion and storage cost, when the data you need is within your cloud provider’s retention window, or when you’d rather query in place than centralize. You still build dashboards, set alerts, and correlate cloud data with your other Grafana data.