GCP Cloud Monitoring data source
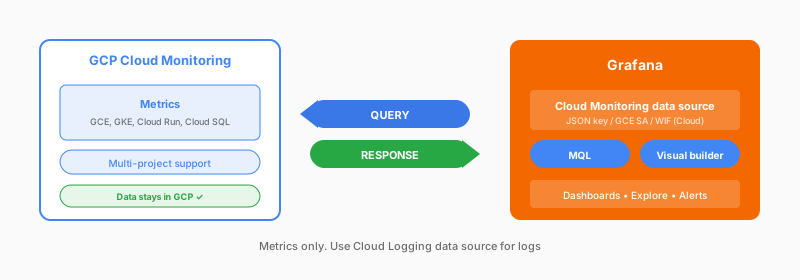
Authenticate with a service account JSON key, the VM’s service account when Grafana runs on Compute Engine, or (Grafana Cloud only) Workload Identity Federation with your OIDC provider. The plugin supports PromQL, Monitoring Query Language (MQL), and a visual query builder. For multi-project setups, grant your service account permissions across the projects and query them all from one Grafana instance.
What you get
- All GCP service metrics
- PromQL, MQL, and visual builder query modes
- Alignment and aggregation
- Template variables
- Label filtering
Considerations
- API latency
- Per-project authentication, typically
- Alert evaluation calls the API
Documentation
View the Cloud Monitoring data source documentation.