Azure Monitor data source
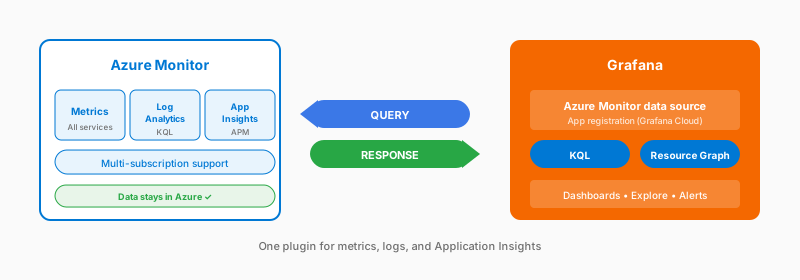
One plugin gives you Azure metrics, Log Analytics workspaces, Application Insights, and Azure Resource Graph. In Grafana Cloud, authenticate with a Microsoft Entra ID app registration (a service principal). Managed identity and workload identity are only for Grafana you host in Azure. Logs use KQL (Kusto Query Language); a logs query builder is also available. Multi-subscription support lets you build dashboards that span your Azure estate.
What you get
- Metrics and Log Analytics in one plugin
- Application Insights integration
- Resource graph for discovery
- Multi-subscription support
- Template variables
Considerations
- KQL, or the logs query builder, for log queries
- Azure API latency
- Alert evaluation calls the API
Documentation
View the Azure Monitor data source documentation.