How data source queries work
Note
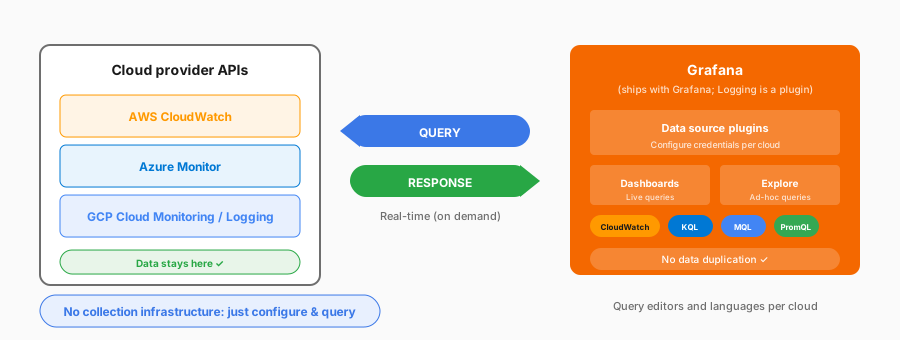
Three of these data sources ship with Grafana; Google Cloud Logging is installed from the plugin catalog. They’re not part of the Cloud Provider Observability product. This section covers them because they’re another way to see your cloud data in Grafana.
The query flow
- Configure cloud provider credentials in Grafana.
- Your data stays in CloudWatch, Azure Monitor, or Cloud Monitoring.
- Grafana queries the cloud API when a panel loads or an alert rule evaluates, unless query caching is enabled.
- Nothing is copied or stored again.
When to choose this approach
A data source fits when:
- You want to avoid Grafana Cloud ingestion and storage cost
- You’re comfortable with each cloud’s query editor (visual builders and, for GCP, PromQL are available)
- You want to keep setup simple
If you want prebuilt dashboards and alerts for all three providers, or one query language across clouds, store the data with Cloud Provider Observability as described in Two options. Storing the data means dashboards and alerts query Grafana Cloud instead of the provider API; scrape jobs still call the provider API on a schedule.