Slide 7 of 10

Azure logs: Grafana Alloy

How it works

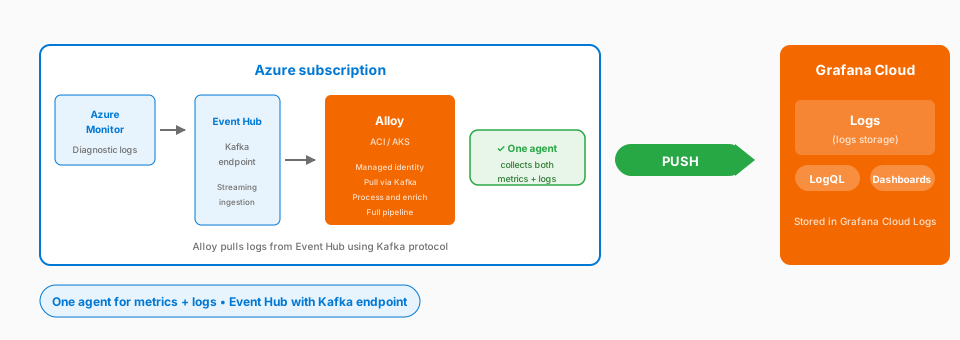
Azure logs Alloy architecture: Azure Monitor to Event Hub with Kafka endpoint, Alloy pulls logs and pushes to Grafana Cloud Logs

Complexity: Flexible | Infrastructure: VM, ACI, or AKS | Latency: Configurable

Azure Monitor streams log data to an Event Hubs namespace with a Kafka endpoint. Alloy pulls the logs using the Kafka protocol and forwards them to Grafana Cloud Logs. Its pipeline can parse, filter, relabel, and enrich logs first. If you already deployed Alloy for metrics, the same deployment can collect logs.

Considerations

  • Event Hub ingestion over the Kafka protocol
  • Full processing pipeline for parsing, filtering, and enrichment
  • Managed identity authentication
  • One deployment for both metrics and logs
  • Alloy infrastructure to deploy, maintain, and update
  • Event Hub setup required

When to use

  • Complex processing needs
  • Event Hub log sources
  • Combined metrics + logs collection

Documentation

View the Azure Alloy logs documentation.

Script

For Azure logs with more flexibility, Alloy is again your answer.

And here’s something nice: if you already deployed Alloy for metrics collection, you can use that same deployment for logs. One collector, multiple jobs.

Here’s how it works: Azure Monitor streams log data to an Event Hubs namespace with a Kafka endpoint. Alloy pulls logs from that Event Hub using the Kafka protocol and forwards them to Grafana Cloud Logs.

Alloy’s processing pipeline lets you parse, filter, relabel, and enrich logs before they reach Grafana Cloud Logs.

If you need complex log processing, if you’re collecting from multiple Azure sources, or if you want one unified collector for both metrics and logs, Alloy is the way to go.