How it works
Note: Unlike AWS and Azure, GCP requires deploying Grafana Alloy. There is no serverless “scrape job” option.
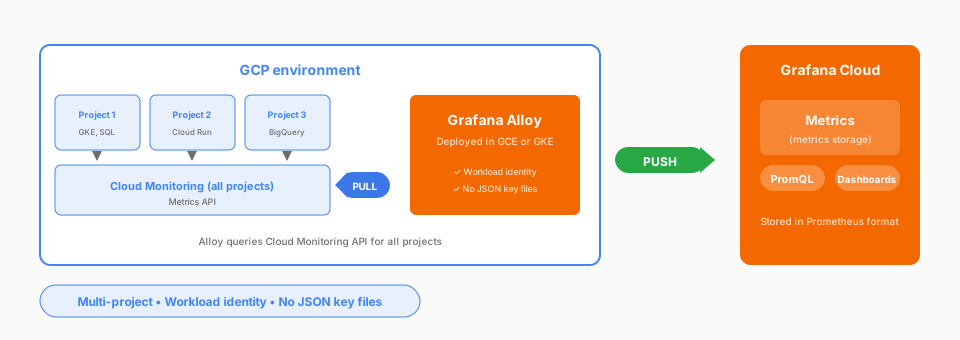
Complexity: Moderate | Infrastructure: GCE or GKE | Latency: Configurable
Alloy collects from Cloud Monitoring using its embedded Stackdriver exporter, then sends the metrics to Grafana Cloud. Its processing pipeline lets you filter, relabel, and aggregate metrics before they’re stored.
Authentication options
Considerations
- Multiple projects from one Alloy deployment
- Workload identity support, so no keys to manage
- Full processing pipeline for filtering, relabeling, and aggregation
- Metrics in Prometheus format for PromQL
- Alloy infrastructure to deploy, maintain, and update
Documentation
View the GCP metrics documentation.