GCP metrics: Grafana Alloy
Note
The documented way to collect GCP metrics is Grafana Alloy.
Complexity: Moderate | Infrastructure: Linux, Windows, or MacOS host | Latency: Configurable
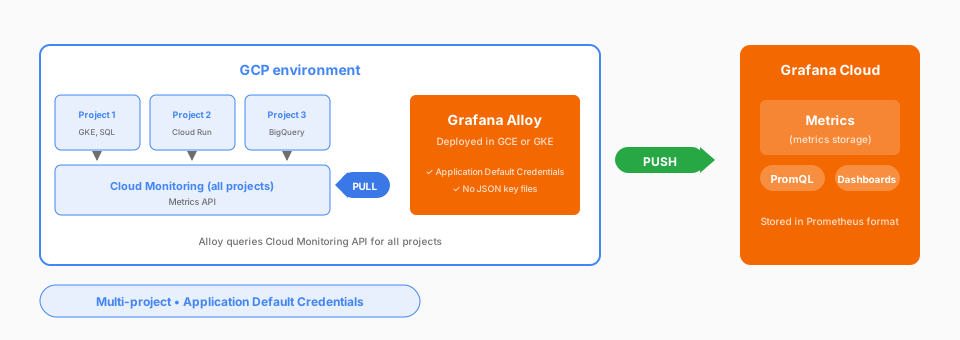
Alloy collects from Cloud Monitoring using its embedded Stackdriver exporter, then sends the metrics to Grafana Cloud. Its processing pipeline lets you filter and relabel metrics before they’re stored. Provide credentials through Google Application Default Credentials, including a service account key or the identity of the VM or pod Alloy runs on.
Considerations
- Multiple projects from one Alloy deployment
- Application Default Credentials, including the identity of the VM or pod
- Processing pipeline for filtering and relabeling
- Metrics in Prometheus format for PromQL
- Alloy infrastructure to deploy, maintain, and update
- Run Alloy as a single instance, not a DaemonSet
Documentation
View the GCP metrics documentation.