How it works
Complexity: Simple | Infrastructure: None | Latency: Minutes
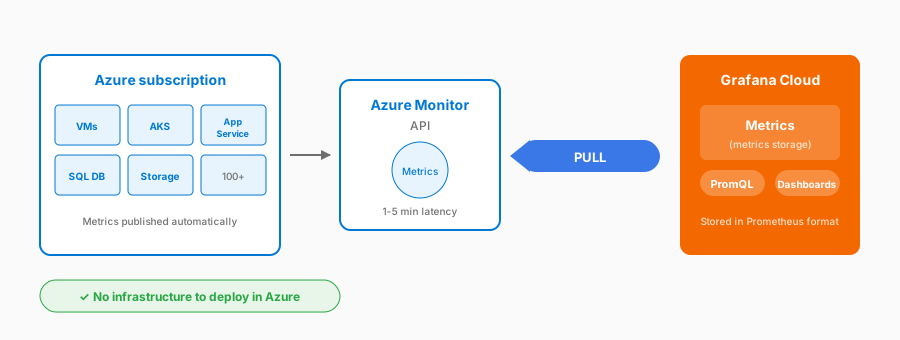
This is the serverless collection method: Grafana Cloud collects Azure metrics through the Azure Monitor API, with no collector or agent to deploy. Collecting with Grafana Alloy is a separate, agent-based method.
Create a service principal in Microsoft Entra ID with read access to Azure Monitor and provide those credentials to Grafana Cloud. Grafana Cloud queries the Azure Monitor API, discovers your resources automatically, and pulls metrics in, converting them to Prometheus format so you can query them with PromQL.
Considerations
- Managed by Grafana Cloud, with no Azure infrastructure to deploy
- Simple service principal authentication
- Automatic resource discovery
- Metrics in Prometheus format for PromQL
- Minute-level latency
- API rate limits at scale
- Per-subscription credentials, so multiple subscriptions need multiple configurations
When to use
- Getting started with Azure metrics
- Single subscription
- Minimal infrastructure preference
Documentation
View the Collect Azure metrics with the serverless solution documentation.
Path
Configure this approach step by step.
Azure metrics: serverless