Azure metrics: serverless
Complexity: Simple | Infrastructure: None | Latency: Minutes
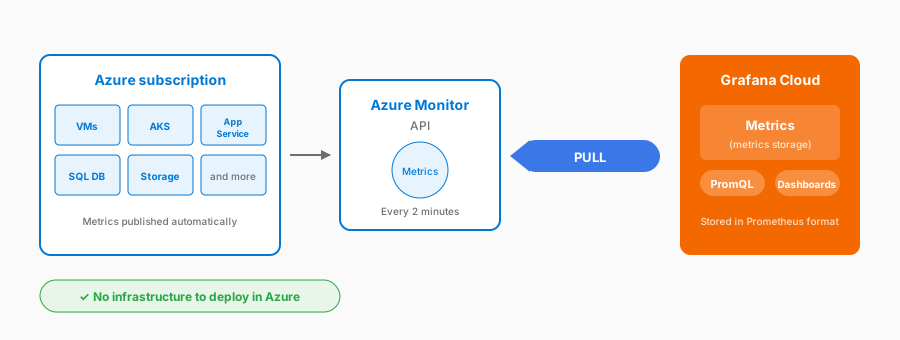
This is the serverless collection method: Grafana Cloud collects Azure metrics through the Azure Monitor API, with no collector or agent to deploy. Collecting with Grafana Alloy is a separate, agent-based method.
Create a service principal in Microsoft Entra ID with read access to Azure Monitor and provide those credentials to Grafana Cloud. Grafana Cloud queries the Azure Monitor API, discovers your resources automatically, and pulls metrics in, converting them to Prometheus format so you can query them with PromQL.
Considerations
- Managed by Grafana Cloud, with no Azure infrastructure to deploy
- Simple service principal authentication
- Automatic resource discovery
- Metrics in Prometheus format for PromQL
- Collected every two minutes
- Occasional Batch API throttling (529 errors) can cause short gaps
- One credential can cover several subscriptions. The service principal needs the Monitoring Reader role on each subscription you collect
- Client secrets expire. A deleted or disabled service principal, or the wrong tenant ID, shows up as an authentication failure
- Newly accessible subscriptions can take up to an hour to appear in discovery
When to use
- Getting started with Azure metrics
- Minimal infrastructure preference
Set it up
Open this path in your Grafana Cloud stack for a fully interactive experience, or read through it to understand the process first. You’ll need access to your Azure account with permissions to create service principals and assign roles. The Collect Azure metrics with the serverless solution documentation covers the same steps in reference form.
Monitor Azure resources with Grafana Cloud
Monitor Azure resources using Grafana Cloud Provider Observability and visualize Azure Monitor metrics through pre-built dashboards without deploying a collector.
Open in Grafana Cloud
Complete this learning path directly in your Grafana Cloud stack with an interactive learning experience.