How it works
Complexity: Moderate | Infrastructure: Firehose + IAM | Latency: Seconds
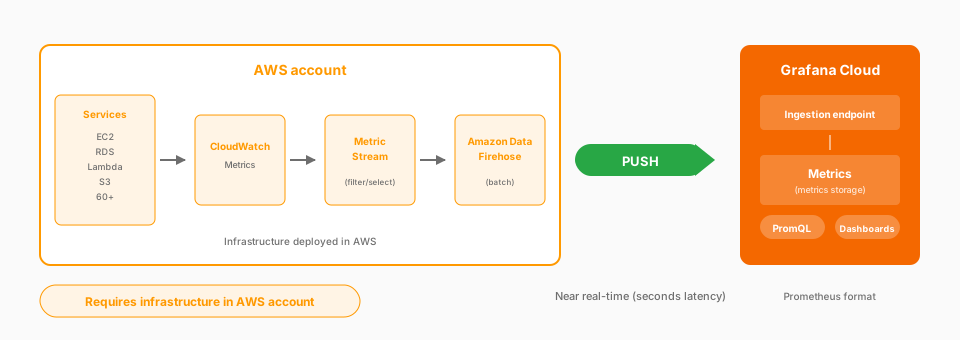
You create a CloudWatch Metric Stream that selects which metrics to export. The stream delivers to an Amazon Data Firehose stream, which batches the metrics and forwards them to Grafana Cloud’s ingestion endpoint. You deploy the Metric Stream, the Firehose delivery stream, and the IAM roles in your AWS account, and you can template all of it with Terraform or CloudFormation.
You also create a resource metadata scrape job. It periodically fetches your AWS resource tags and metadata, which Grafana Cloud combines with the streamed metrics to enrich them with context like resource ARNs and tags.
Considerations
- Near real-time delivery, within seconds
- Scaling without API rate limits
- Predictable cost at scale
- No scrape schedules to manage
- AWS infrastructure to deploy: the Metric Stream, an Amazon Data Firehose delivery stream, and IAM roles
- A resource metadata scrape job to enrich metrics with resource ARNs and tags
- Upfront setup, which you can template with Terraform or CloudFormation
Note
If you automate the setup with Terraform, you also need permission to create an access policy token, which typically requires the Admin role.
When to use
- Production monitoring where seconds-level alerting latency matters
- Environments that scale across multiple AWS accounts
- Setups where you want no scrape schedules to manage
Documentation
View the AWS metric streams documentation.