How it works
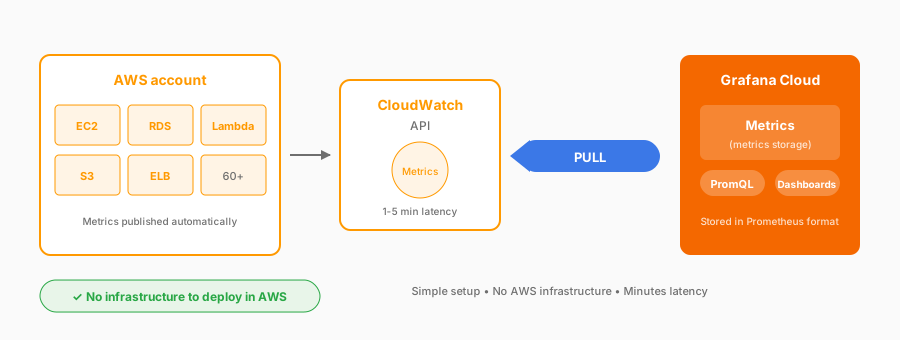
Complexity: Simple | Infrastructure: None | Latency: Minutes
Configure an AWS integration in the Grafana Cloud UI and provide IAM credentials, typically a read-only user or role. Choose which regions and CloudWatch namespaces to scrape, such as EC2, RDS, or Lambda. Grafana Cloud queries the CloudWatch API on a schedule, pulls the metrics in, and converts them to Prometheus format so you can query them with PromQL.
Considerations
- Configured entirely in the Grafana Cloud UI, with no AWS infrastructure to deploy
- 60+ AWS services with automatic service discovery
- Metrics in Prometheus format for PromQL
- 1-5 minute latency
- CloudWatch API cost and rate limits at scale
- IAM setup for cross-account access
When to use
- Quick start and evaluation
- Proof-of-concept setups
- Small environments with moderate metric volume
For ongoing production monitoring: See metric streams.
Path
Configure this approach step by step.
AWS metrics scrape jobs