AWS metrics: scrape jobs
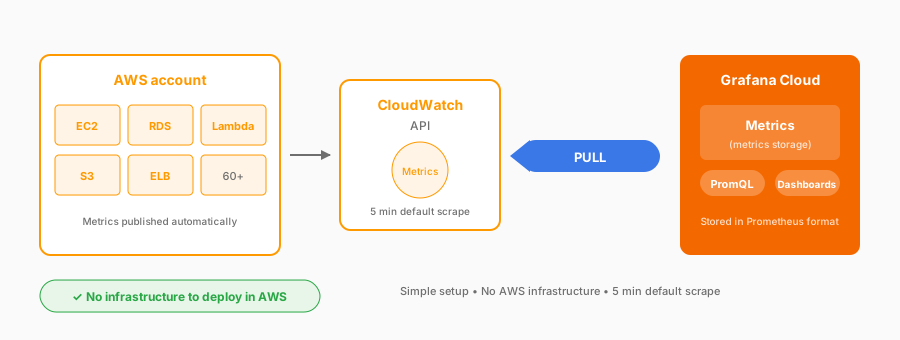
Complexity: Simple | Infrastructure: None | Latency: 5 min default
Create an IAM role that Grafana Cloud assumes; you don’t hand over access keys. Choose which regions and CloudWatch namespaces to scrape, such as EC2, RDS, or Lambda. Each listed service includes a default set of metrics. A custom namespace is not in that list: you add the namespace and enter its metrics. Grafana Cloud queries the CloudWatch API on a schedule, pulls the metrics in, and converts them to Prometheus format so you can query them with PromQL.
Considerations
- Configured entirely in the Grafana Cloud UI, with no AWS infrastructure to deploy
- 60+ AWS services supported
- Metrics in Prometheus format for PromQL
- Default scrape interval of 5 minutes (configurable)
- CloudWatch API cost and rate limits at scale
- IAM setup for cross-account access
- Resources must be tagged; scrape jobs export only tagged resources
- A scrape job has a resource limit per service across regions. Split the job by region, or ask Grafana support to raise the limit
- Metrics for a deleted resource can keep appearing for about three hours. Remove its tags before you delete it
When to use
- Quick start and evaluation
- Proof-of-concept setups
- Small environments with moderate metric volume
For ongoing production monitoring, use metric streams instead.
Set it up
Open this path in your Grafana Cloud stack for a fully interactive experience, or read through it to understand the process first. You’ll need access to your AWS account with permissions to create IAM roles.
Monitor AWS resources
Monitor AWS resources with Grafana Cloud Provider Observability by collecting Amazon CloudWatch metrics through pre-built dashboards.
Open in Grafana Cloud
Complete this learning path directly in your Grafana Cloud stack with an interactive learning experience.