Two options for monitoring cloud provider data
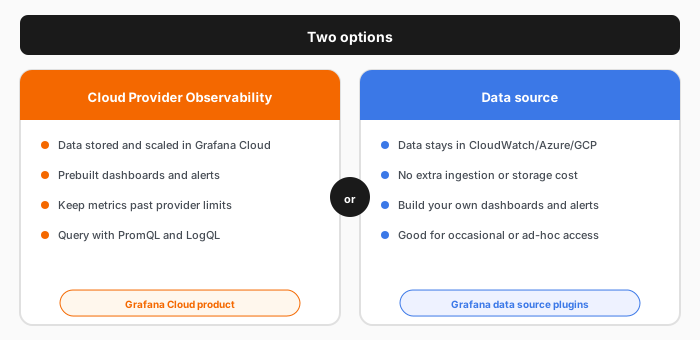
Both options let you visualize, correlate, and alert on your cloud data. The difference is where your data lives and how much comes prebuilt.
Cloud Provider Observability
The Grafana Cloud product for monitoring AWS, Azure, and GCP. It sends your metrics and logs to Grafana Cloud Metrics and Grafana Cloud Logs, so:
- Prebuilt dashboards and alerts: Cloud Provider Observability installs dashboards and alerts for AWS, Azure, and GCP.
- One query language: query metrics and logs with PromQL and LogQL.
- Added cost: storing data in Grafana Cloud adds ingestion and storage cost.
A data source
A CloudWatch, Azure Monitor, or Cloud Monitoring data source connects to your data where it lives, so:
- No Grafana Cloud ingestion or storage cost: your data isn’t copied or stored again. Your provider may bill each API query.
- Importable dashboards: the CloudWatch and Azure Monitor data sources ship dashboards you can import. They don’t ship alert rules. The Google Cloud Monitoring data source ships neither.
- Occasional access: a good fit for data you query occasionally or would rather not duplicate.
The practical distinction is cost:
- Cloud Provider Observability adds ingestion and storage cost for a prebuilt, curated experience.
- A data source adds no Grafana Cloud ingestion or storage cost because it queries your data where it lives. Your provider may bill each API query.
You don’t have to choose one approach for everything. For example, store your production data in Grafana Cloud, and query dev or ad-hoc data in place with a data source.