Dashboards
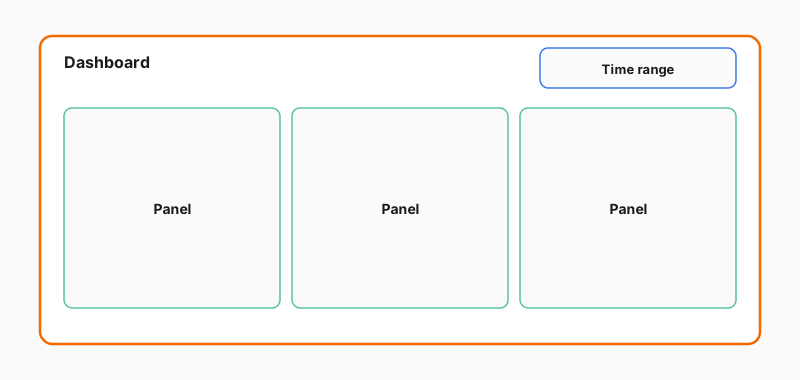
A dashboard is a single saved page that shows related information at a glance. Two parts make it work:
- Panel: One view of your data, for example a chart, graph, or table. A dashboard is a set of one or more panels.
- Time range: The window of time the panels are showing
When you change the time range, the panels on the page update to match it.
Why it matters
Someone builds a dashboard once, and everyone can use it from then on. When you want to know how a system is doing, you open its page and the answer is already laid out. You don’t need to build anything. If you can recognize a panel and the time range, you can read a dashboard someone else built.
See for yourself
The guide below walks you through the dashboard list, one open dashboard, its panels, the menu in each panel’s corner, and a time range you change yourself. It runs on Grafana Play, so you don’t need an account.
Use dashboards to check a system's health
Complete this interactive guide in the Grafana Play stack with an interactive learning experience.