How to find and filter logs
After you open a service, Logs Drilldown gives you labels, fields, and the text of the log line. Use them together when you need a narrower set of lines.
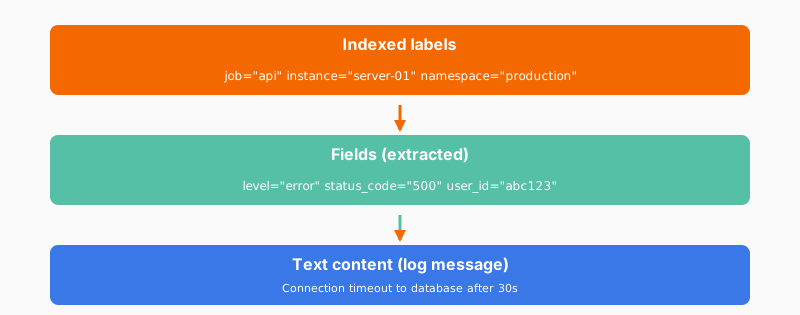
The three layers
Logs Drilldown also adds a detected_level label for the level Loki assigns, including debug, info, warn, error, fatal, critical, trace, or unknown when no level could be determined.
A way to narrow the logs
- On the Labels tab, select Select or Include on a label to see its values and filter.
- On the Fields tab, select Select for a value breakdown, or Include or Add to filter to filter by a field value. Select Extract fields from logs if the field you need is inside the log line.
- On the Logs tab, type text in the line filter to keep or drop matching lines.
The Patterns tab groups similar log lines from the previous three hours, when pattern ingestion is enabled. A time range that is entirely older than those three hours shows no patterns. Patterns also do not support multi-tenant or cross-stack data sources.