Read transcript
Audio transcript
Logs have a different structure than metrics, so you filter them differently in Grafana Logs Drilldown. Let’s break down how it works.
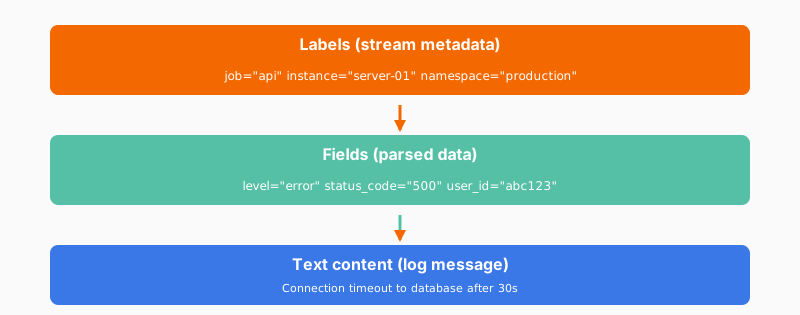
Labels identify log streams. These are the same kind of labels you saw with metrics. Job, instance, namespace. They tell you where the logs came from.
Fields are what make logs searchable. They can be structured metadata sent with the logs or parsed from the log content itself (like JSON or logfmt). Fields include things like log level, status codes, request IDs, or any other values. These become filterable dimensions.
Then there’s the text content itself. The actual log messages. Logs Drilldown lets you search this text without regular expressions. Just type what you’re looking for.
The combination of labels, fields, and text search gives you multiple ways to narrow down to the logs you care about. Filter by the service first using labels, then by error level using fields, then search for a specific error message in the text.