How to find and filter metrics
Prometheus metrics have a name, labels, and label values. Metrics Drilldown lets you move through that structure.
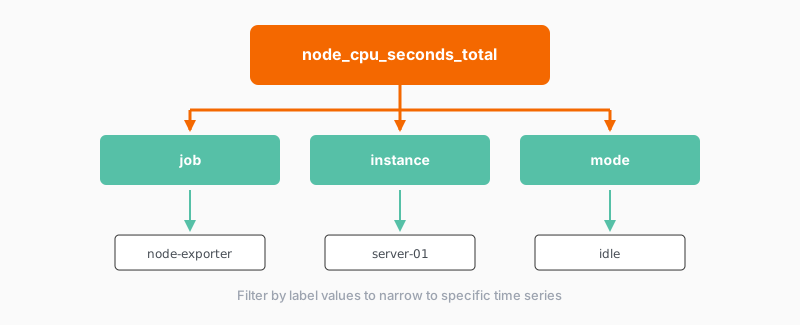
The structure
How you move through it
- Select a data source.
- Optionally select Add label and choose a label name, an operator, and a value. You can also type keywords in the metric search bar.
- Select the metric. The control on the metric panel is Select.
- On the Breakdown tab, select Select on a label, then select Add to filters on the value you want.
The Breakdown tab shows a time series for each label-value pair of the metric you selected.
If a metric or its labels appear in Explore but not here, the data source Series limit may be hiding them. The default is 40,000, and it applies to metrics, labels, and values. Search with a name filter such as __name__ = vm_http, or raise Series limit in the Prometheus data source settings. Raising the limit can affect Metrics Drilldown performance.