Slide 3 of 3

No-data and error handling

No-data and error handling

Each time an alert rule runs, it evaluates its query and decides whether to fire or stay quiet. Sometimes the rule runs but can’t decide whether to fire for two reasons:

  • The query returns no data. In this case, Grafana assigns a state of No Data. This happens when:
    • No series match the query due to an incorrect metric or label filter
    • The data source stops reporting
    • The time window has no samples, often because the evaluation window or query range is too short for how often the data arrives
  • The query fails to run. If this occurs, Grafana assigns a state of Error. This can happen with:
    • Evaluation timeouts
    • Repeated query failures from a data source that’s down
    • An authentication problem

Those auto-generated alerts use names like DatasourceNoData and DatasourceError, so your team may not recognize them or connect them back to your rule.

How to handle evaluation issues
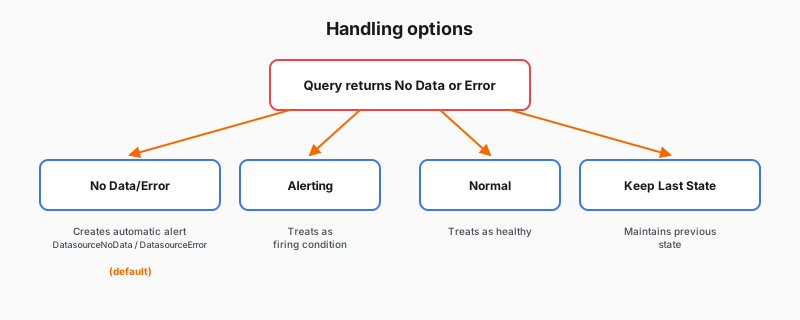
Diagram showing the four no-data and error handling options branching from a query that returns no data
You can choose other options to keep your rule out of the No Data and Error states. This means no separate alert is created, and the response stays tied to your rule’s own name and routing.

Alert stateUse this state whenWhat happens
AlertingNo data means something is broken, like a heartbeat check where silence equals an outageMakes your own rule fire
NormalGaps are expected and harmless, like a metric that only reports during business hoursKeeps your rule quiet and healthy
Keep Last StateGaps are brief and self-healing, and you want to avoid the rule flapping on a missed scrapeHolds whatever state your rule had before the gap
No Data/Error (default)You want a separate signal that the data pipeline broke, routed apart from your ruleLeaves your rule quiet and raises a separate alert named DatasourceNoData (for No Data) or DatasourceError (for Error)

Common mistake

The Configure no data and error handling options in Grafana are powerful, but they require close attention. Don’t set the Alert state if no data or all values are null option to Normal unless you’re certain that data gaps are safe. Otherwise your rule stays silent during a real outage, and you hear nothing when the underlying data source stops reporting.

Script

Imagine a rule that watches QuickPizza for server errors. Each time the rule runs, it evaluates the query and decides whether the 5xx count is above your threshold and should fire, or at zero and should stay quiet.

But sometimes the rule runs and can’t reach a clear yes or no answer. The query comes back empty, which Grafana calls No Data, or the query fails to run at all, which Grafana calls Error.

Here’s the part that trips people up. The separate alert isn’t created just because the query came back empty. It’s created only when your rule actually lands in the No Data or Error state, which is what the default does. That separate alert isn’t your rule. It has an auto-generated name like DatasourceNoData or DatasourceError, so your team may not recognize it or connect it back to your rule.

You can change that. The handling option you pick decides which state your rule lands in. The other three options keep your rule out of these states, so no separate alert appears. Alerting makes your rule fire. Normal keeps it quiet and healthy. Keep Last State holds whatever state your rule had before the gap.

Be careful with Normal. If a server really stops reporting, your rule stays silent and you hear nothing about a real outage.