Slide 3 of 3

Alert condition

Alert condition

The alert condition defines when an alert moves toward firing. A threshold is the value the condition compares against.

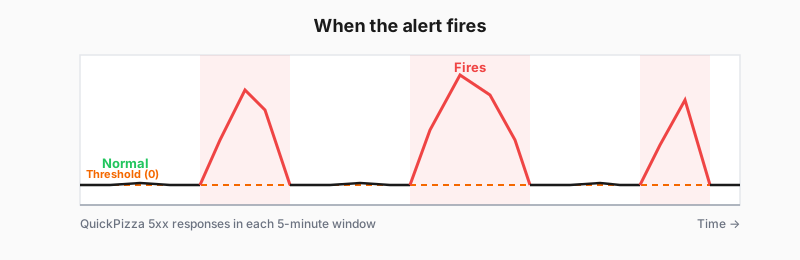
The condition watches a value over time. If the value stays at or below the threshold, the alert stays normal. When it rises above the threshold and stays there through the pending period you configure later, the alert fires.

For this journey’s QuickPizza server-errors example, the value is how many new 5xx responses arrived in the last five minutes. Alert when that count is above 0 so any server errors in the window can trigger the rule. The alert condition has two parts:

  • Is above is the operator.
  • 0 is the threshold.
Line chart of QuickPizza 5xx responses over five-minute windows — near zero when healthy, spiking when errors appear — with a dashed threshold line at 0; the alert is normal at zero and moves toward firing while the value is above it

Important: verify after setting

Always click Preview alert rule condition to verify which instances would fire. If you change the operator from Is above to Is below, double-check that the threshold value still makes sense.

Script

The alert condition is what tells Grafana the difference between things being fine and things requiring attention.

An operator and a threshold define what too high means. For this journey’s QuickPizza server-errors example, the value is the count of new 5xx responses over the last five minutes. A threshold of zero means any server errors in that window can move the rule toward firing, after the pending period you set later.

Each time series in your query is evaluated independently, so any series that crosses the threshold can fire on its own. When you sum the series into one total, you get a single instance for the whole service.