Slide 1 of 3

What is an alert rule

What is an alert rule

An alert rule tells Grafana what data to watch. It defines a threshold for when something becomes a problem, and it defines what to do when something goes wrong and an alert is triggered. You create an alert by completing the New alert rule page in the UI, where you fill out the following sections:
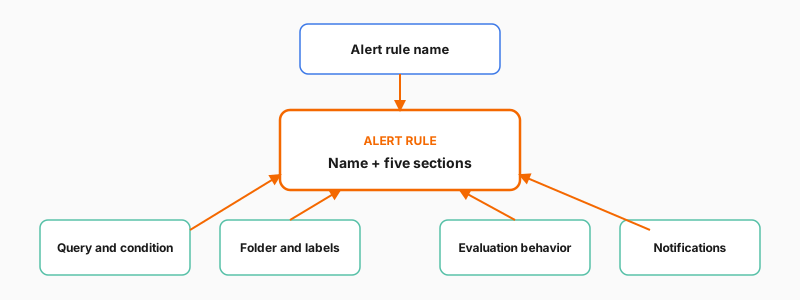
SectionWhat you set up
Alert rule nameA descriptive name so your team knows what fired
Query and conditionWhich data to watch and what “too high” or “too low” means
Folder and labelsWhere to store the rule and how to tag it
Evaluation behaviorHow often Grafana checks and how long to wait before alerting
NotificationsWhere to send the notification when something goes wrong
Diagram of an alert rule made of a name plus five sections: query and condition, folder and labels, evaluation behavior, and notifications

Why the name matters

The alert rule name shows up in every notification your team receives. A vague name like “Alert 1” tells the responder nothing about what’s wrong. Your alert rule name is the first piece of critical information a responder will see, so a clear naming structure for your alerts helps responders act faster.

Choose names that describe what you’re monitoring and where, for example:

  • “QuickPizza server errors”
  • “Payment service error rate above 5%”
  • “Database connection pool exhausted”

Script

An alert rule tells Grafana what to watch. It defines a threshold for when something becomes a problem, and it defines what to do when something goes wrong and an alert is triggered.

It comes together across multiple sections in the Grafana UI, each handling a different part of the setup.

The name you give your alert rule matters most in the long run. It shows up in every notification your team receives, so it should describe what you’re monitoring. A vague name like Alert 1 tells the responder nothing about what’s wrong.