This is documentation for the next version of Grafana k6 documentation. For the latest stable release, go to the latest version.
Grafana dashboards
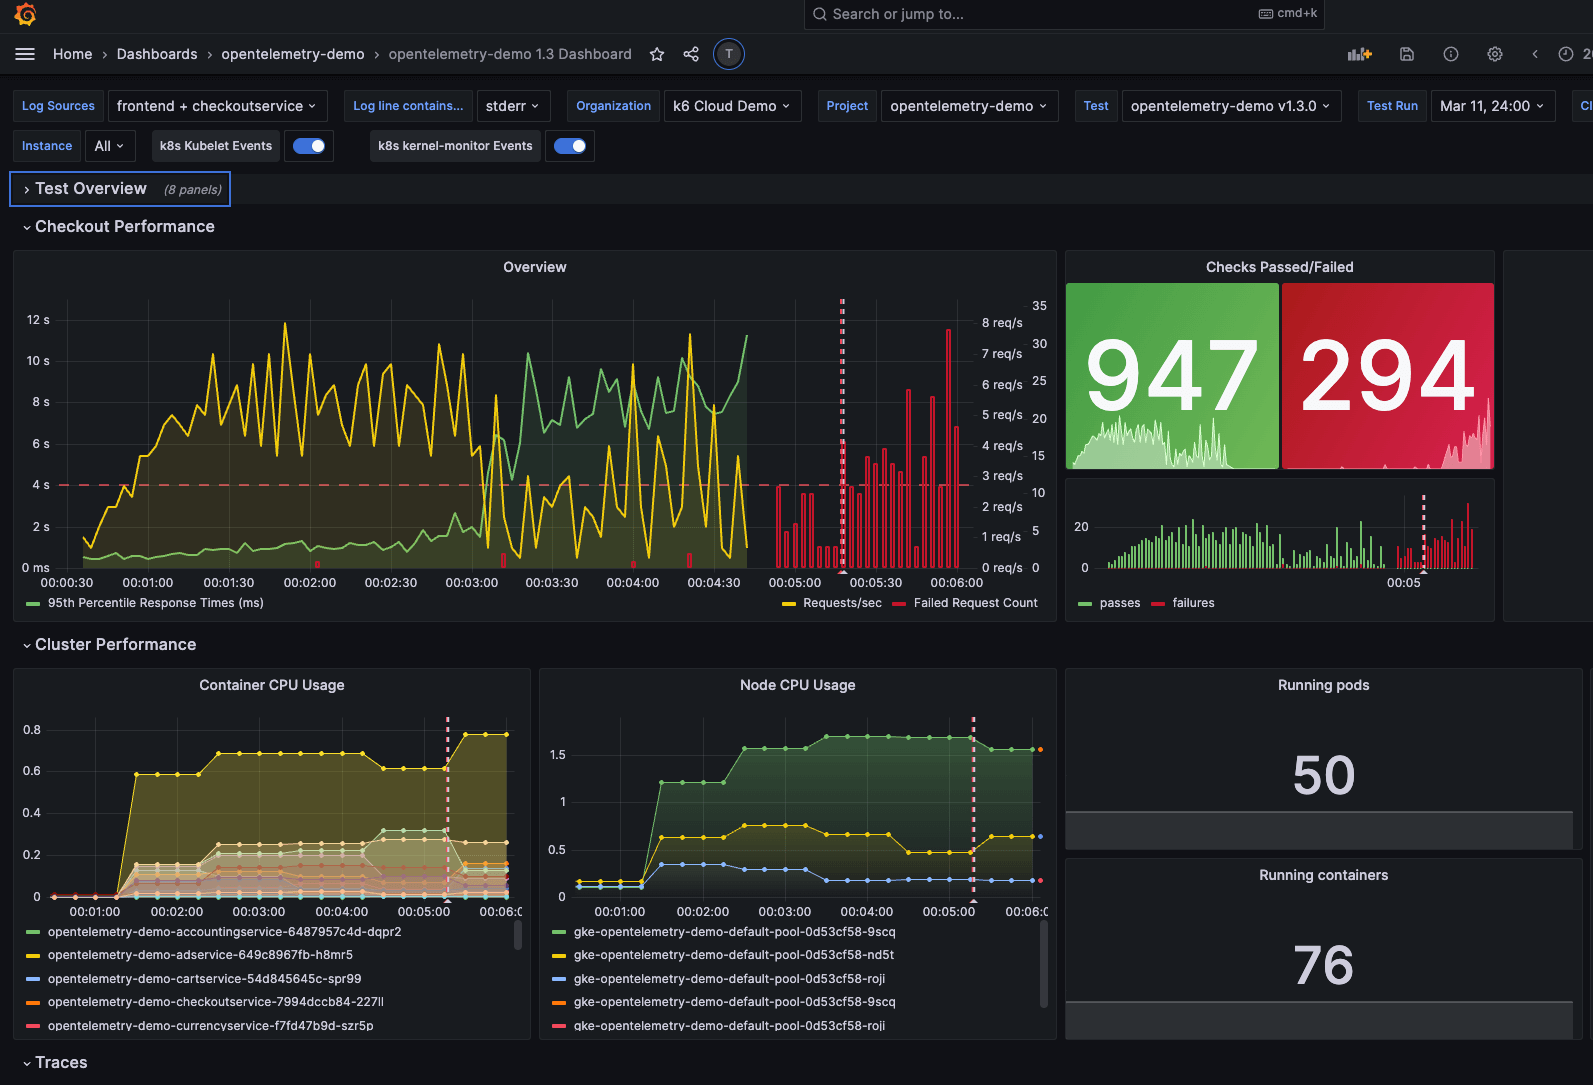
You have multiple ways to query k6 results in Grafana. Having test results in a dashboard brings various benefits:
- Visualize your results to analyze performance during the test run or over multiple test runs.
- Correlate test results with application and system metrics in the same dashboard to get a holistic overview of your system’s performance and quickly find the root causes of performance issues.
Options
With Grafana, you can create a custom dashboard to query and visualize data from multiple sources and any type of backend. Using k6, you can stream your local test results to any backend.
The flexibility and interoperability of Grafana and k6 let you visualize test and observability data in one dashboard, regardless of where the data is stored. The following outputs include pre-built Grafana dashboards for their storage:
For a fully managed solution, Grafana Cloud k6 is our commercial product to store, view, scale, and manage your tests with ease. It provides custom views to access your testing and analyze test results, enhanced collaboration features, and many more additional capabilities.

