Web dashboard
k6 provides a built-in web dashboard that you can enable to visualize and monitor your tests results in real-time.

The dashboard provides a real-time overview of the performance observed by k6 while a test is running, and can help you identify potential reliability issues as they occur.
How to use
The web dashboard is a built-in feature of k6. You can enable it by setting the K6_WEB_DASHBOARD environment variable to true when running your test script, for example:
K6_WEB_DASHBOARD=true k6 run script.jsK6_WEB_DASHBOARD=true ./k6 run script.js
/\ Grafana /‾‾/
/\ / \ |\ __ / /
/ \/ \ | |/ / / ‾‾\
/ \ | ( | (‾) |
/ __________ \ |_|\_\ \_____/
execution: local
script: ../extensions/xk6-dashboard/script.js
web dashboard: http://127.0.0.1:5665
output: -By default, the web dashboard is available on localhost port 5665. You can change the host and port by using the dashboard options.
Note
The k6 process waits to exit as long as there’s at least one open browser window for the dashboard extension.
In certain environments, such as a CI/CD pipeline, the k6 process has to exit after the test run completes. In that case, it’s advisable to disable the HTTP port by setting it to
-1.
Generate HTML test reports
You can generate detailed, downloadable HTML reports directly from the web dashboard or the command line. These reports are self-contained, making them ideal for sharing with your team.
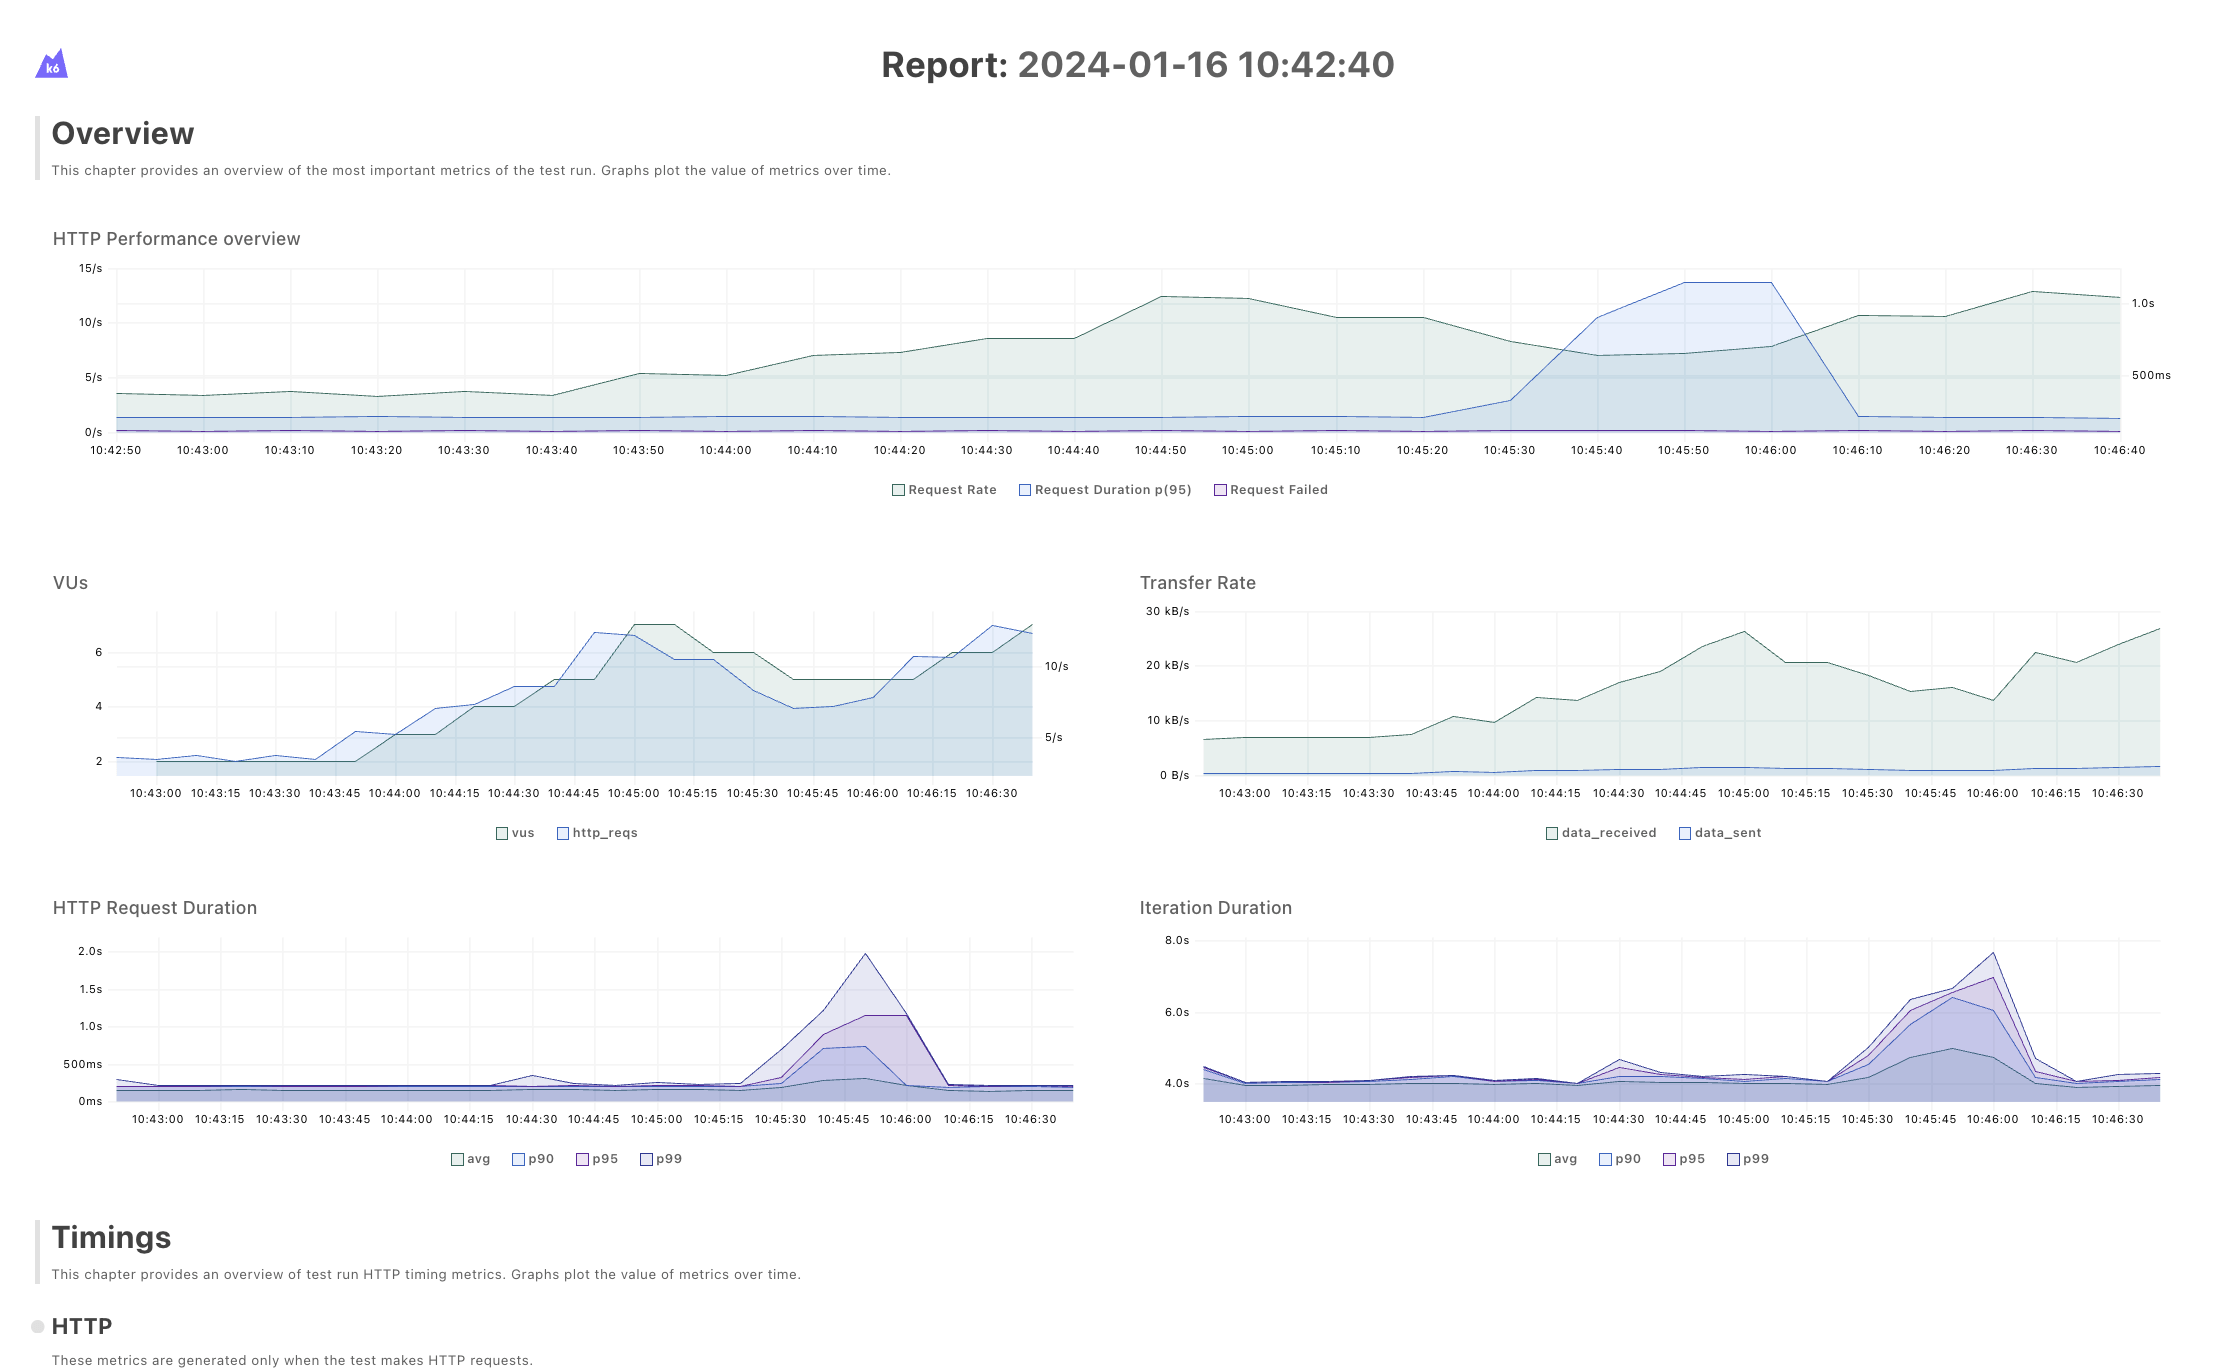
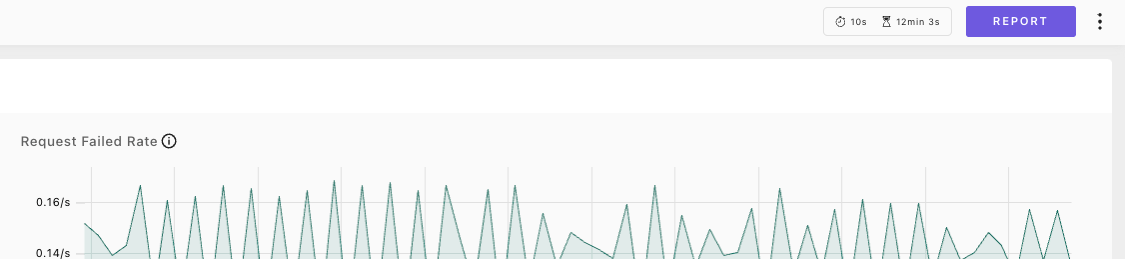
Generate report from web dashboard
To generate a report from the web dashboard, click Report on the dashboard’s menu.
Generate report from the command line
To automatically generate a report from the command line once the test finishes running, use the K6_WEB_DASHBOARD_EXPORT option. For example:
K6_WEB_DASHBOARD=true K6_WEB_DASHBOARD_EXPORT=html-report.html k6 run script.jsNote
The report only includes graphs if the test duration is greater than three times the aggregation period value, set by the
K6_WEB_DASHBOARD_PERIODvariable.
Dashboard options
The web dashboard can be configured using environment variables:

