TimescaleDB
Using the TimescaleDB k6 extension, you can store k6 metrics in TimescaleDB and analyze your performance results with SQL and dashboards. The extension repository includes two Grafana dashboards.
Build the k6 version
To build a k6 binary with the extension, first, make sure you have Go and Git installed on your machine.
Then, open your terminal and run the following commands:
# Install xk6
go install go.k6.io/xk6/cmd/xk6@latest

# Build the k6 binary
xk6 build --with github.com/grafana/xk6-output-timescaledb

... [INFO] Build environment ready
... [INFO] Building k6
... [INFO] Build complete: ./k6
xk6 will create the new k6 binary in the local folder.
Note
To learn more about how to build custom k6 versions, check out xk6.
Run the test
Check that the TimescaleDB instance is running. Copy the Postgres connection string of the database, which will store the k6 metrics.
Use the previous k6 binary and run the test passing the Postgres connection string to the output option as follows:
k6 run script.js -o timescaledb=postgresql://<postgresql_user_name>:<password>@<ip>:<port>/<database>k6 runs the test script and sends the metrics in real-time to the TimescaleDB instance. You can now connect to TimescaleDB and query the k6 metrics.
k6=# SELECT metric,AVG (value) FROM samples GROUP BY metric;Options
Here is the full list of options that can be configured and passed to the extension:
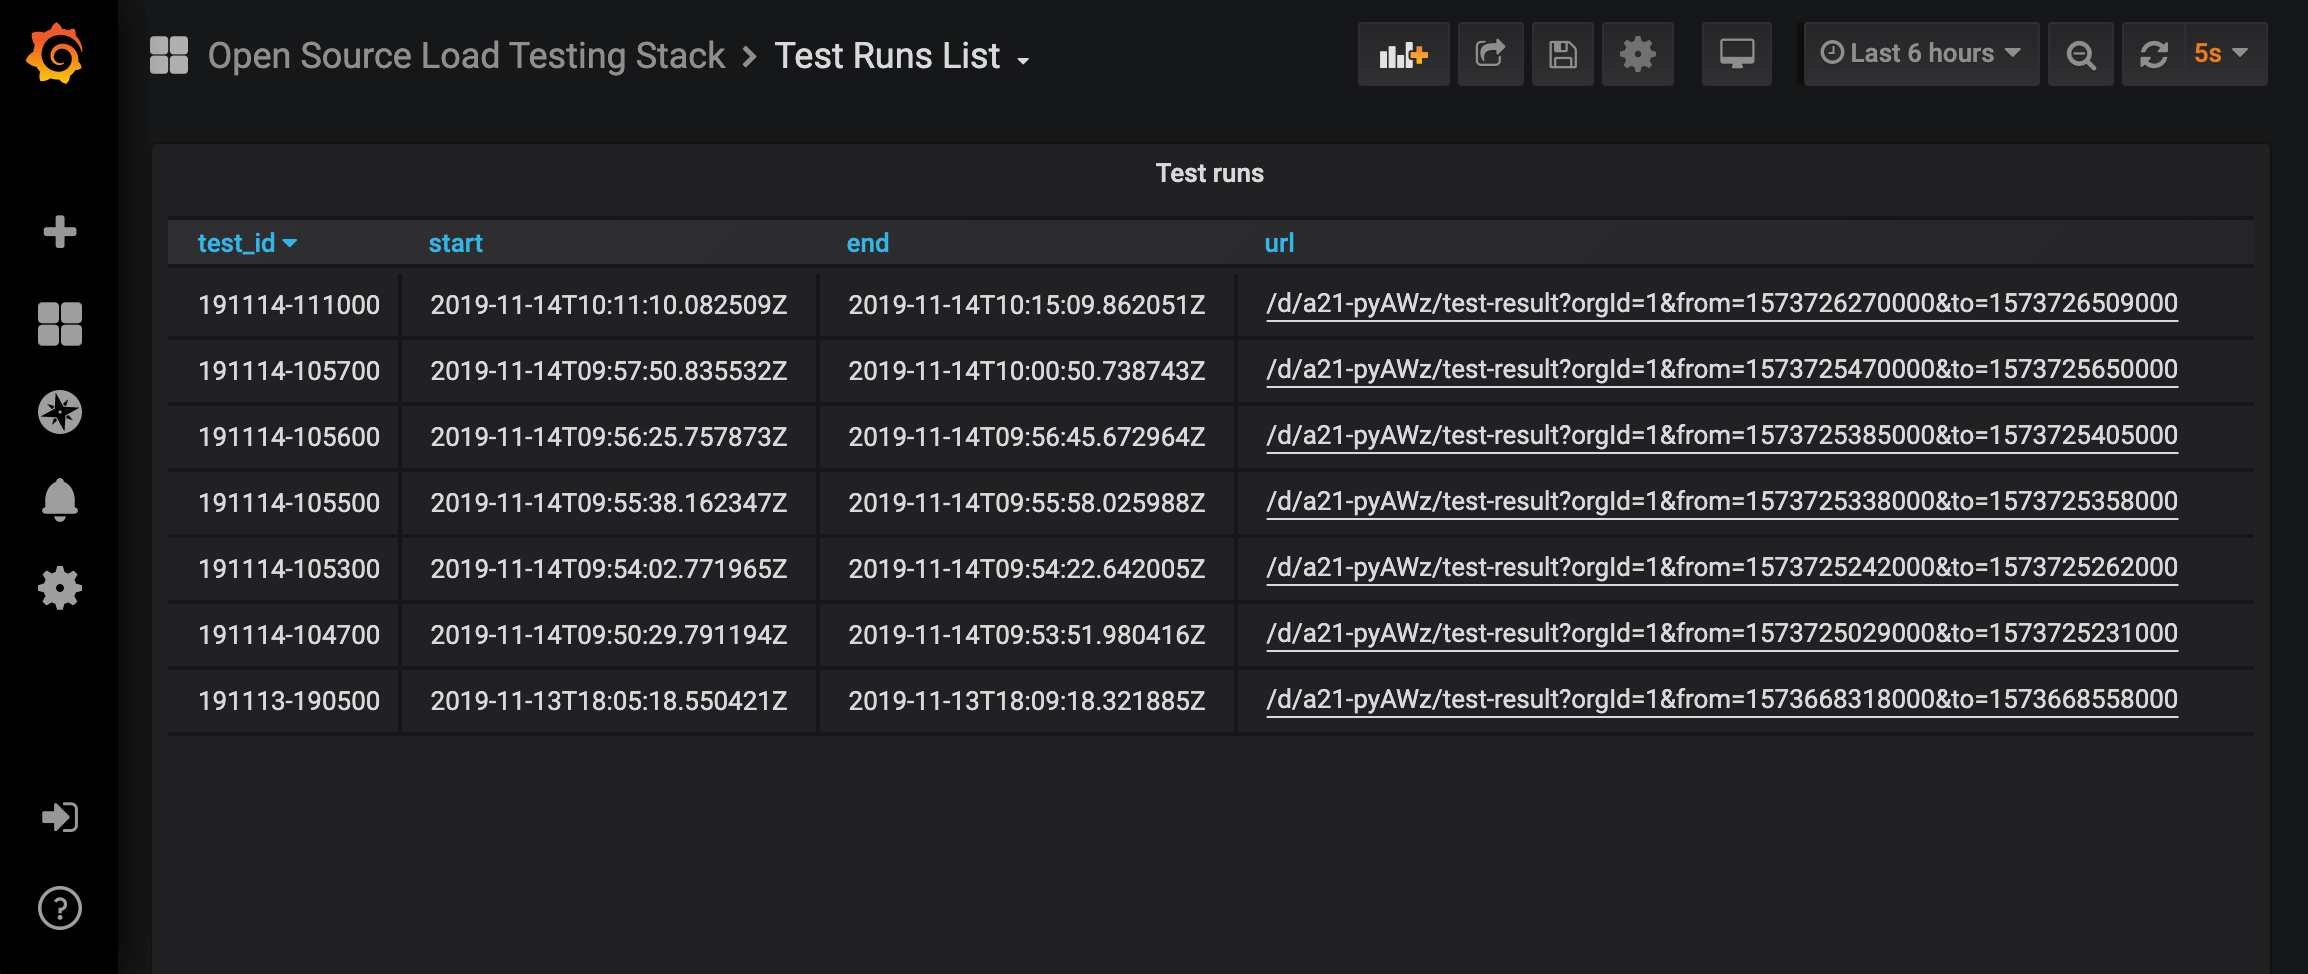
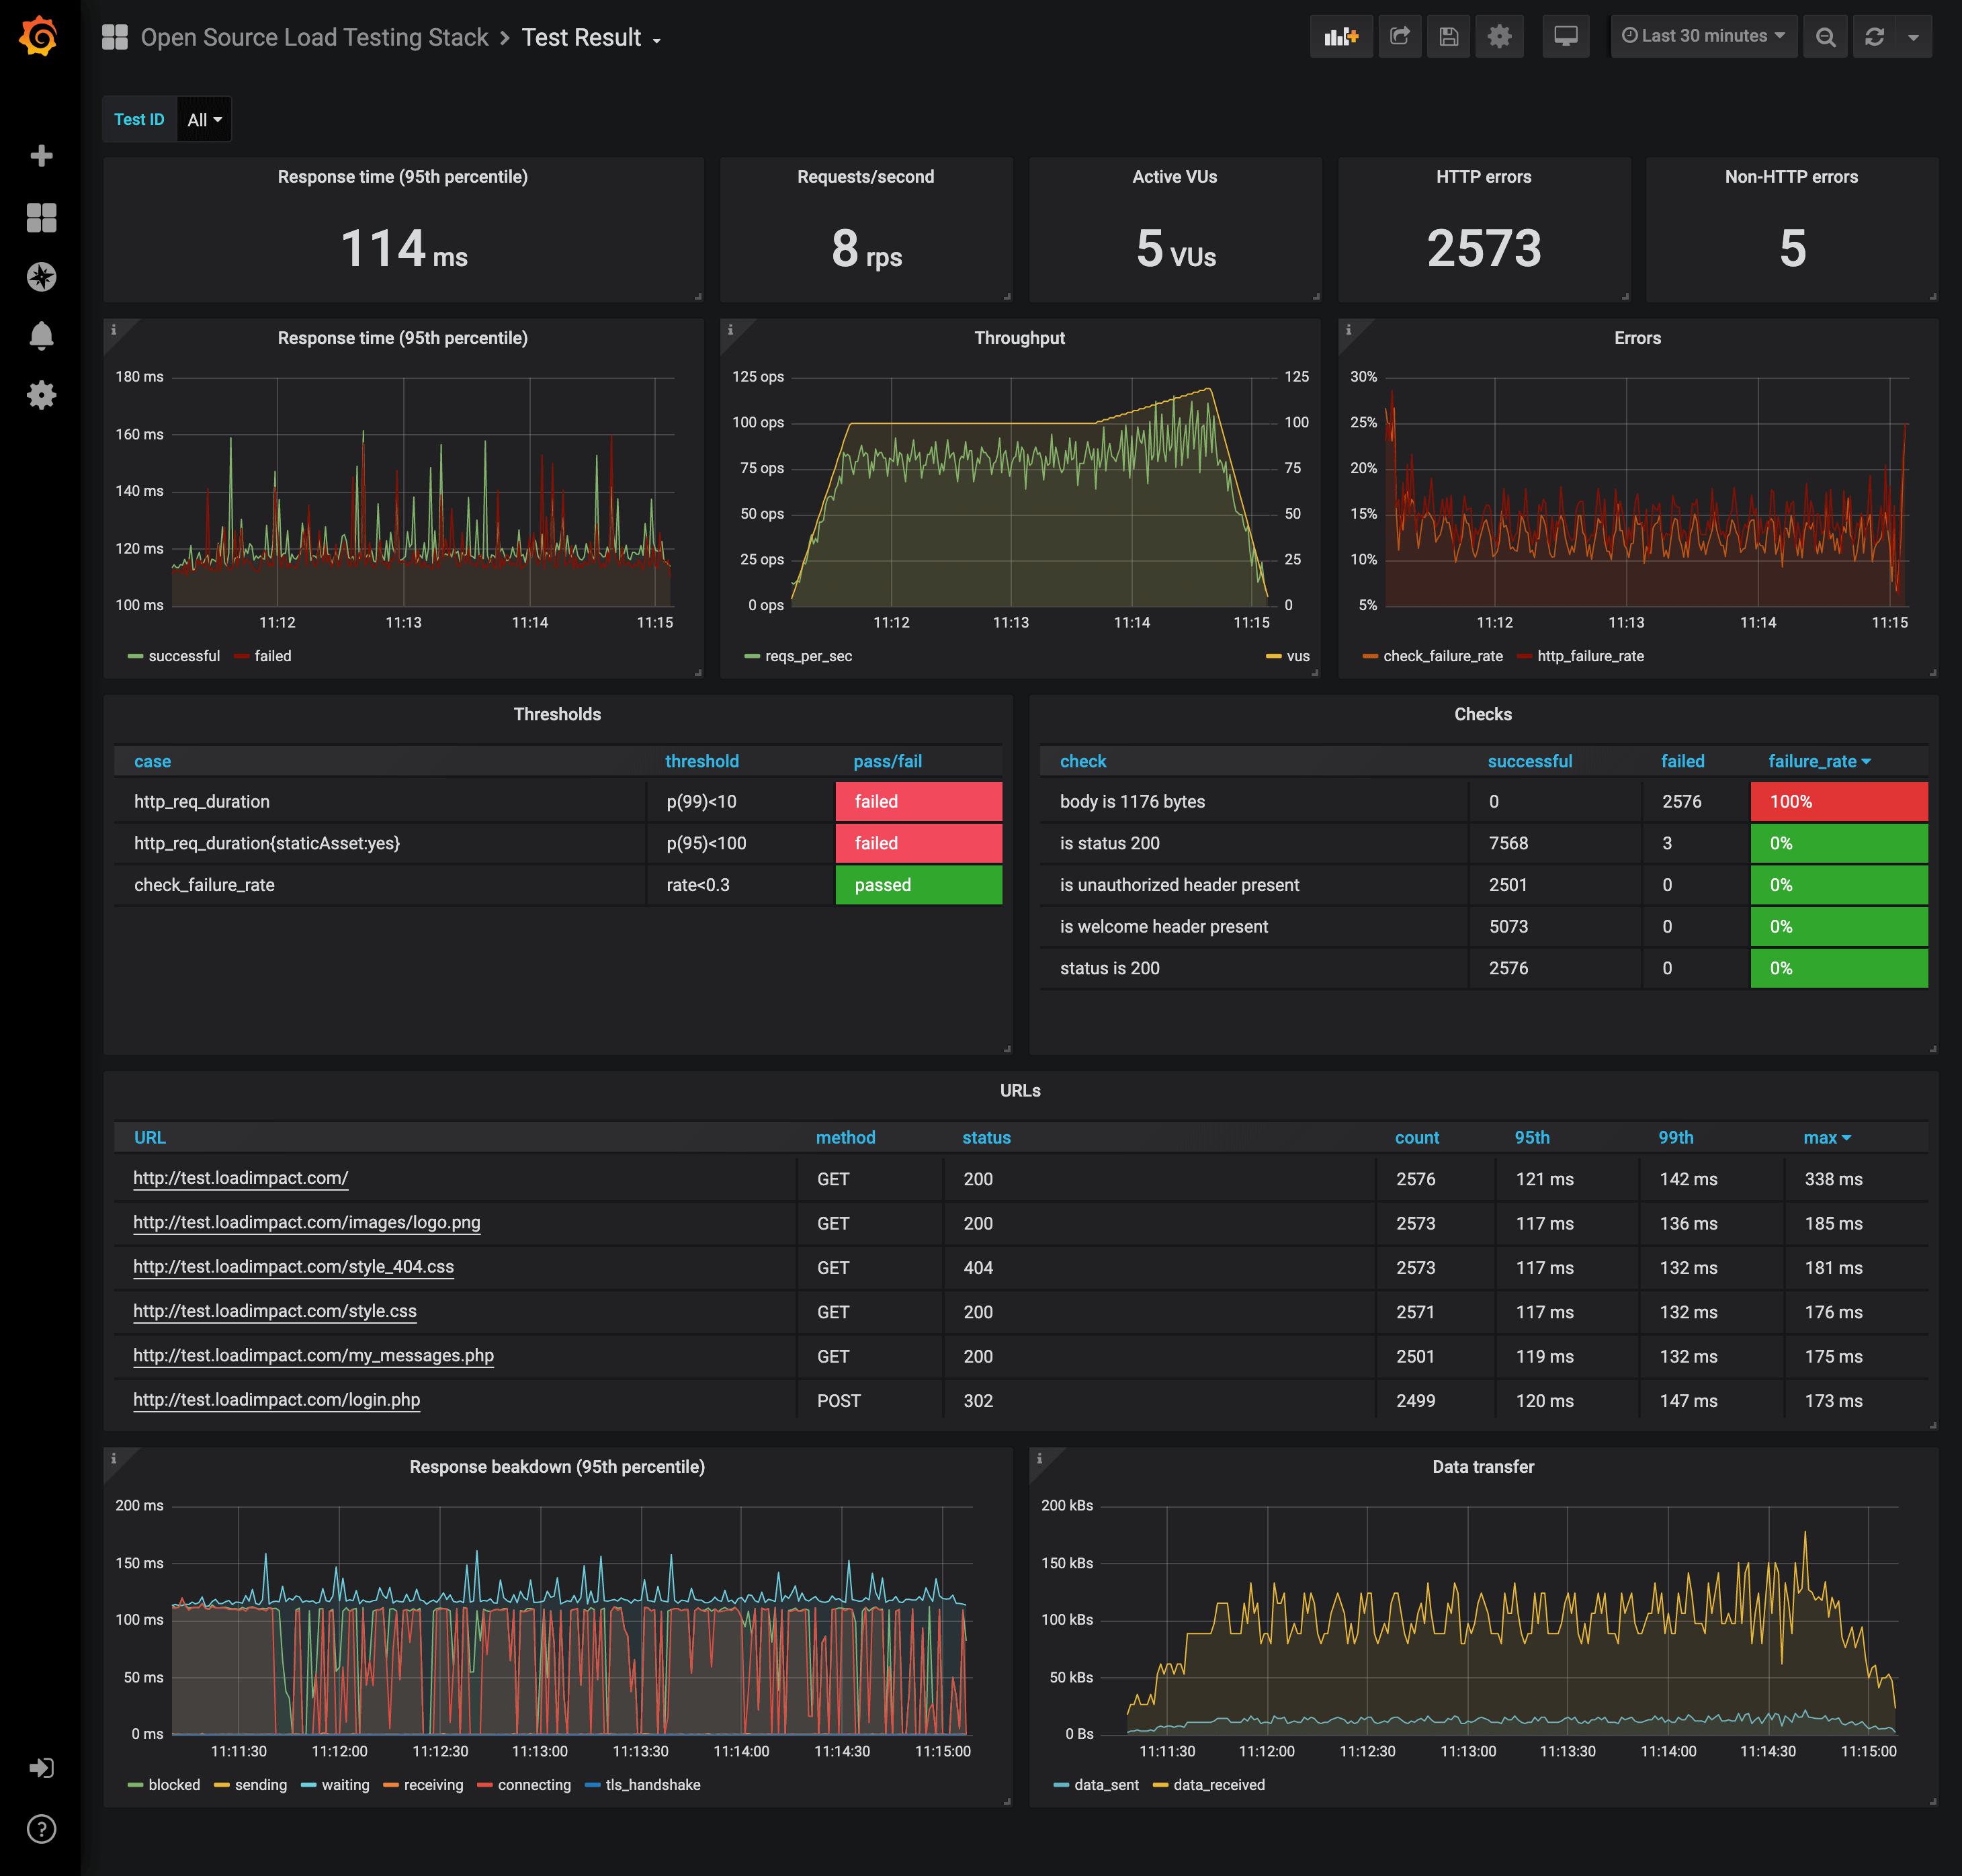
Grafana Dashboards
The extension repository includes a docker-compose setup with two pre-built dashboards to:
- list test runs
- visualize the results of a test run