New Relic
Note
The built-in StatsD output has been deprecated on k6 v0.47.0 and removed in v0.55.0. You can continue to stream metrics to StatsD by using the xk6-output-statsd extension, or using the OpenTelemetry output depending on your use case.
For more information on the reason behind this change, you can follow this issue in the k6 repository.
k6 can send telemetry data to New Relic through the New Relic StatsD integration. Within New Relic you can find your k6 performance data alongside your real users data and server side performance. This data can be visualized in dashboards and shared with others, used to compare load impact with system performance, and alert on metrics too.
This guide covers running the New Relic integration:
- Run the New Relic StatsD integration
- Run the k6 test
- Visualize k6 telemetry in New Relic
Before you begin
To use the StatsD output option, you have to build a k6 binary using the xk6-output-statsd extension. For more details, refer to StatsD.
Run the New Relic StatsD integration
To get k6 metrics into New Relic, k6 sends metrics to the New Relic StatsD integration which will take care of collecting, aggregate, format and send the telemetry to the New Relic Telemetry Data Platform. You can run this with or without a New Relic agent.
Run the New Relic integration as a Docker container with this command:
docker run --rm \
  -d \
  --name newrelic-statsd \
  -h $(hostname) \
  -e NR_ACCOUNT_ID=<NR-ACCOUNT-ID> \
  -e NR_API_KEY="<NR-INSERT-API-KEY>" \
  -p 8125:8125/udp \
  newrelic/nri-statsd:latest
Replace <NR-ACCOUNT-ID> with your New Relic Account ID and <NR-INSERT-API-KEY> with your New Relic Insert API Key.
If your account is hosted in the New Relic EU region, then also add this to the above command: -e NR_EU_REGION=true \
The required environment variables used in the above command are:
Optional environment variables you can use:
About the New Relic integration
The New Relic StatsD integration installed above can run standalone. Installing a New Relic agent is optional.
Everything provided in the command above is enough to send k6 performance metrics to New Relic. You can optionally however add further configuration, further define metrics and their formats (you can however do this on the New Relic side configuration), add custom tags, and create alerts. This is covered in the optional table below.
Run the k6 test
Once the integration is running, run the k6 test and send the metrics to the integration with:
K6_STATSD_ENABLE_TAGS=true k6 run --out output-statsd script.jsMake sure you’re using the k6 binary you built with the xk6-output-statsd extension.
You can look at the StatsD output page for configuration options.
Visualisation in New Relic
As your k6 test is running, k6 is sending performance metrics to the New Relic StatsD integration which in turn is sending these metrics to the New Relic Telemetry Data Platform. These will be prefixed with k6. so you can identify them.

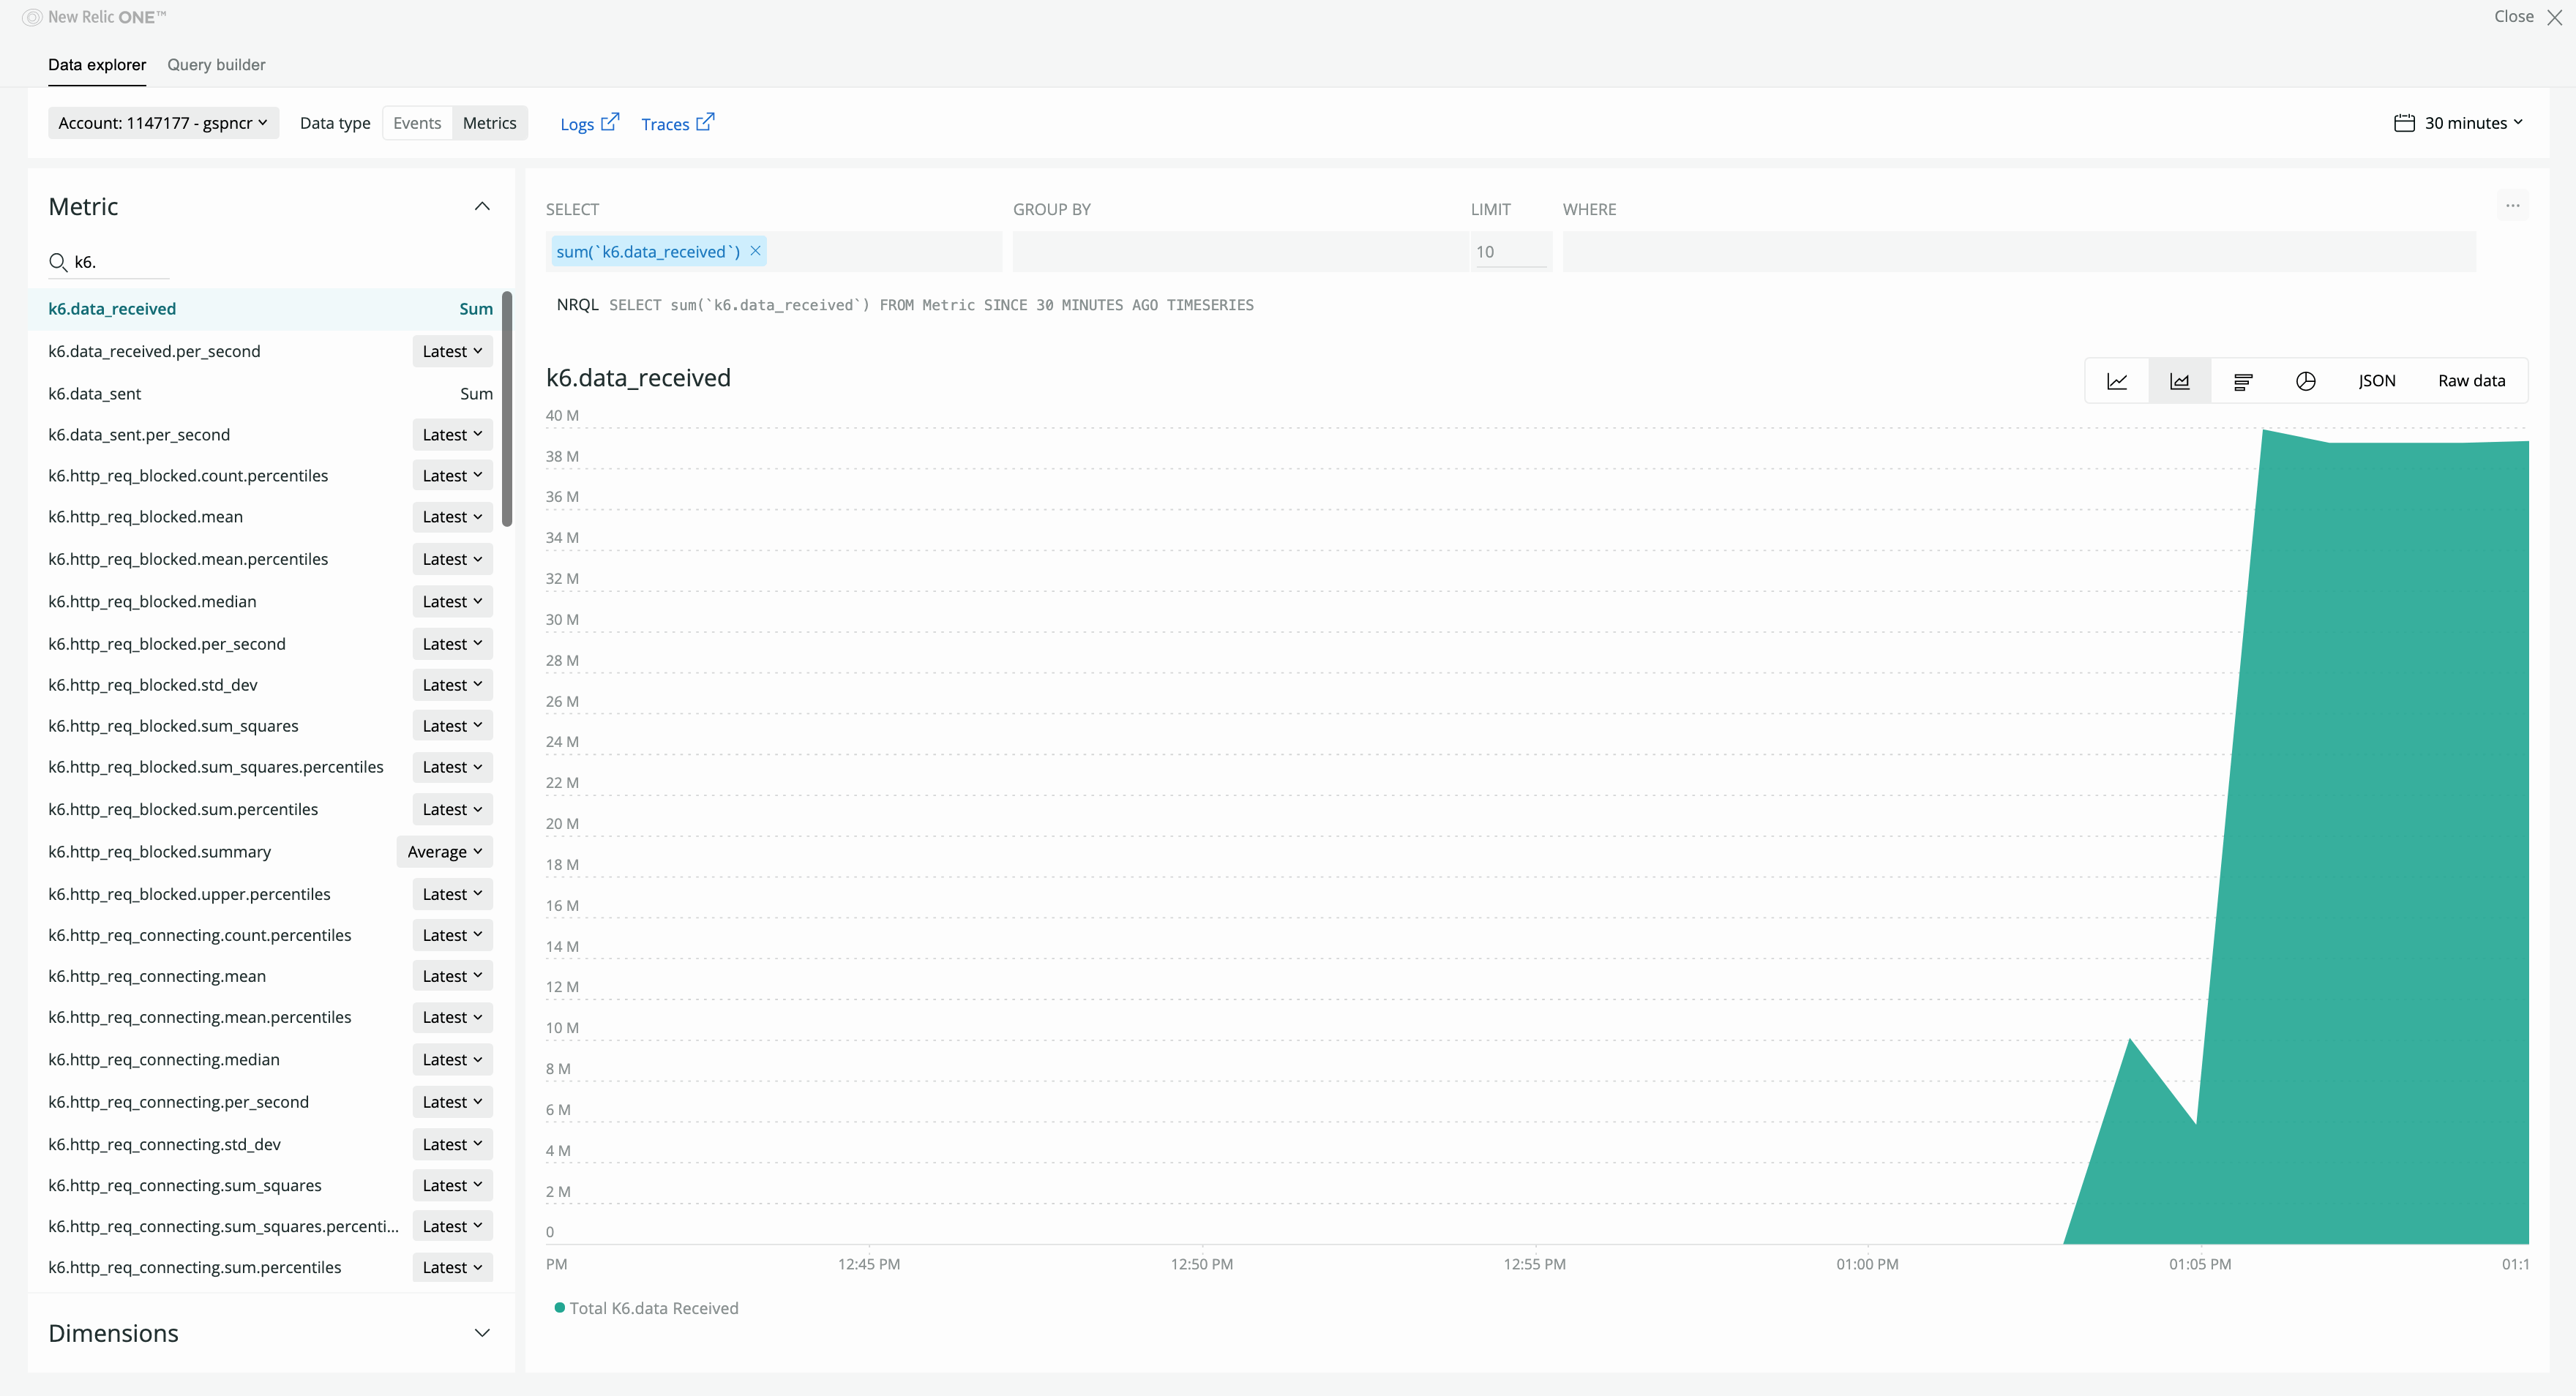
You can visualize the metrics sent from this integration in the data explorer in the top right of New Relic (query your data).

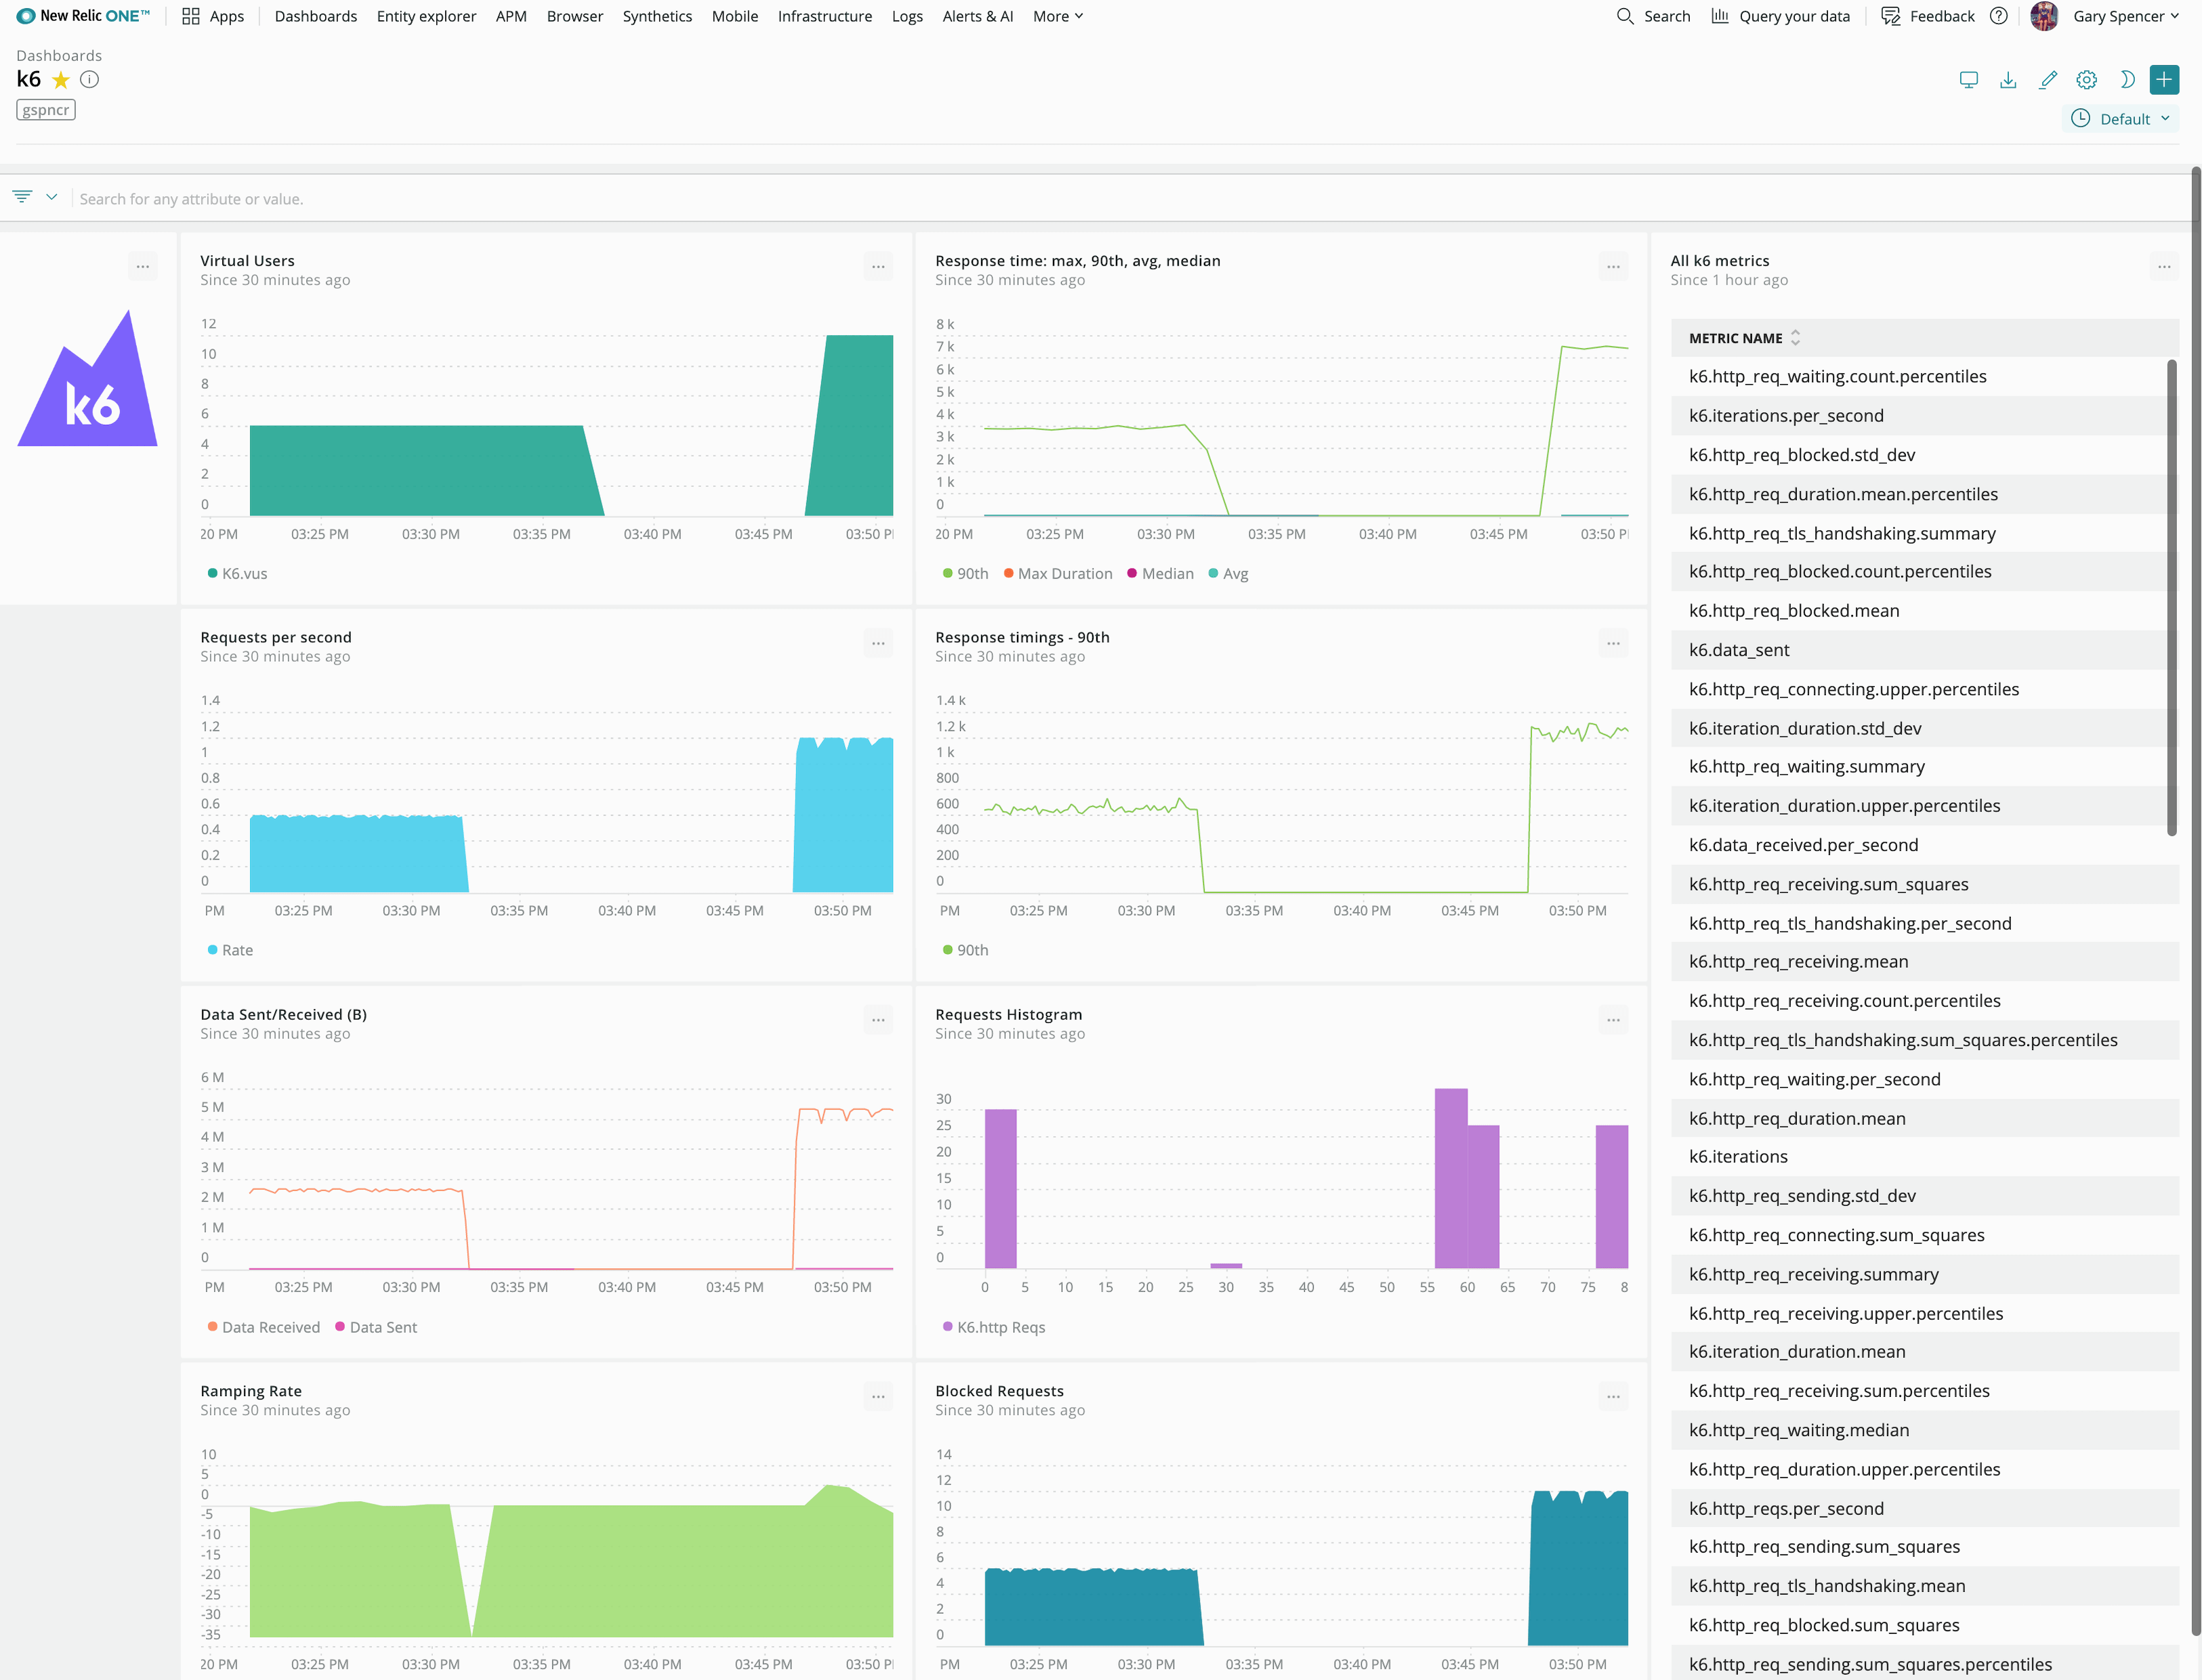
You can also add these metrics to dashboards and alert on k6 metrics.
Example NRQL Queries
Note
New Relic doesn’t support calculating percentiles from metric data, which is the data format sent by this k6 output. See this New Relic forum post and the documentation about the metric data type for details.
Here are some example NRQL queries you can easily copy and paste into widgets in a New Relic dashboard, you can however stick with the chart builder. Find all your k6 Metrics under the metrics tab, prefixed with k6.
Number of Virtual Users
SELECT latest(k6.vus) FROM Metric TIMESERIESMax, Median, and Average Request Duration
SELECT max(k6.http_req_duration.summary) AS 'Max Duration', average(k6.http_req_duration.median) AS 'Median', average(k6.http_req_duration.mean) AS 'Avg' FROM Metric TIMESERIESRate of Requests
SELECT rate(max(k6.http_reqs), 1 seconds) FROM Metric TIMESERIESData Sent and Data Received
SELECT sum(k6.data_received) as 'Data Received', max(k6.data_sent) AS 'Data Sent' FROM Metric TIMESERIESHistogram bucketing Requests
SELECT histogram(`k6.http_reqs`, 80, 20) FROM MetricChange in the number of Requests
SELECT derivative(k6.http_reqs, 30 seconds) AS 'Rate /reqs' FROM Metric TIMESERIESScrolling List of all k6 Performance Metrics
SELECT uniques(metricName) FROM Metric WHERE metricName LIKE 'k6%' LIMIT MAX
