Datadog
Note
The built-in StatsD output has been deprecated on k6 v0.47.0 and removed in v0.55.0. You can continue to stream metrics to StatsD by using the xk6-output-statsd extension, or using the OpenTelemetry output depending on your use case.
For more information on the reason behind this change, you can follow this issue in the k6 repository.
k6 can send metrics to Datadog. That allows visualizing and correlating performance testing metrics with other monitored metrics in Datadog.
This guide covers how to:
- Run the Datadog Agent
- Run the k6 test
- Visualize in Datadog
Before you begin
To use the StatsD output option, you have to build a k6 binary using the xk6-output-statsd extension. For more details, refer to StatsD.
Run the Datadog Agent
To get k6 metrics into Datadog, k6 sends metrics through the Datadog Agent, which collects, aggregates, and forwards the metrics to the Datadog platform.
Run the Datadog Agent service as a Docker container with this command:
DOCKER_CONTENT_TRUST=1 \
docker run --rm -d \
    --name datadog \
    -v /var/run/docker.sock:/var/run/docker.sock:ro \
    -v /proc/:/host/proc/:ro \
    -v /sys/fs/cgroup/:/host/sys/fs/cgroup:ro \
    -e DD_SITE="datadoghq.com" \
    -e DD_API_KEY=<YOUR_DATADOG_API_KEY> \
    -e DD_DOGSTATSD_NON_LOCAL_TRAFFIC=1 \
    -p 8125:8125/udp \
    datadog/agent:latest
For DD_SITE, make sure to use the correct Datadog site URL.
Replace <YOUR_DATADOG_API_KEY> with your Datadog API key.
Note
For additional information, refer to the Datadog Docker Agent documentation.
DogStatsD
The Datadog agent includes the DogStatsD service to collect and aggregate metrics. DogStatsD implements the StatsD protocol with some extensions. For example, DogStatsD tagging allows to collect k6 metrics with tags to distinguish between requests for different URLs, response statuses, groups, etc.
The instruction above runs the DogStatsD service in a Docker container, but it’s also possible to run it either as Host Agent, Kubernetes, and Helm.
Run the k6 test
Once the Datadog Agent service is running, run the k6 test and send the metrics to the Agent with:
K6_STATSD_ENABLE_TAGS=true k6 run --out output-statsd script.jsMake sure you’re using the k6 binary you built with the xk6-output-statsd extension.
You can look at the StatsD output page for configuration options.
Visualize in Datadog
While running the test, k6 sends metrics periodically to Datadog. By default, these metrics have k6. as the name prefix.
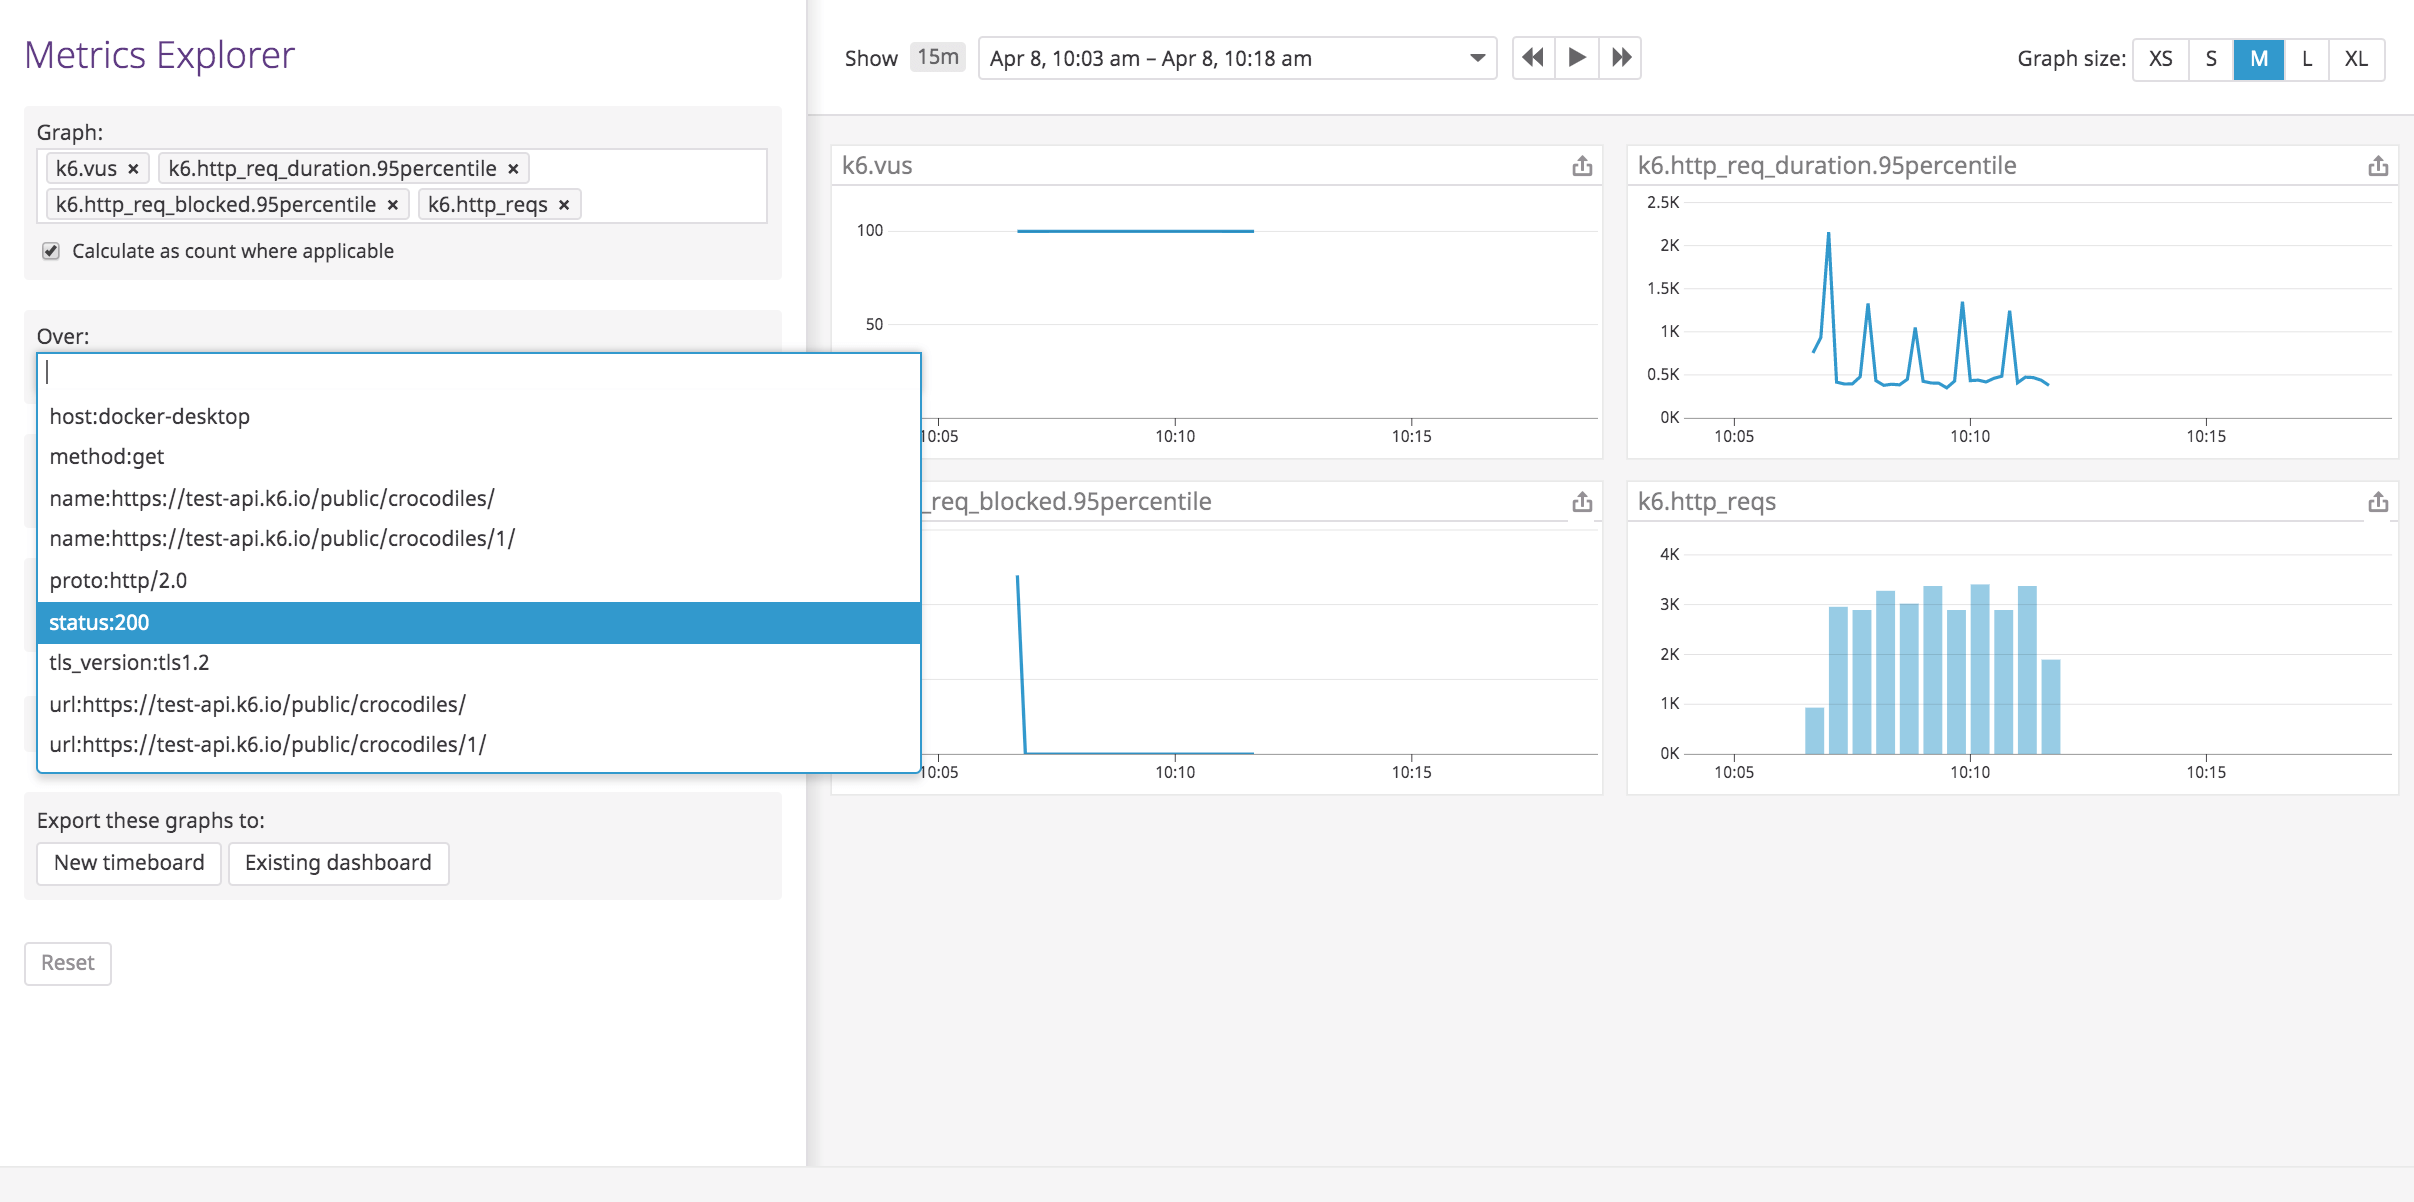
You can visualize k6 metrics in real-time with the metrics explorer, monitors, or custom dashboards.

To learn more about all the types of k6 metrics, read the k6 Metrics guide
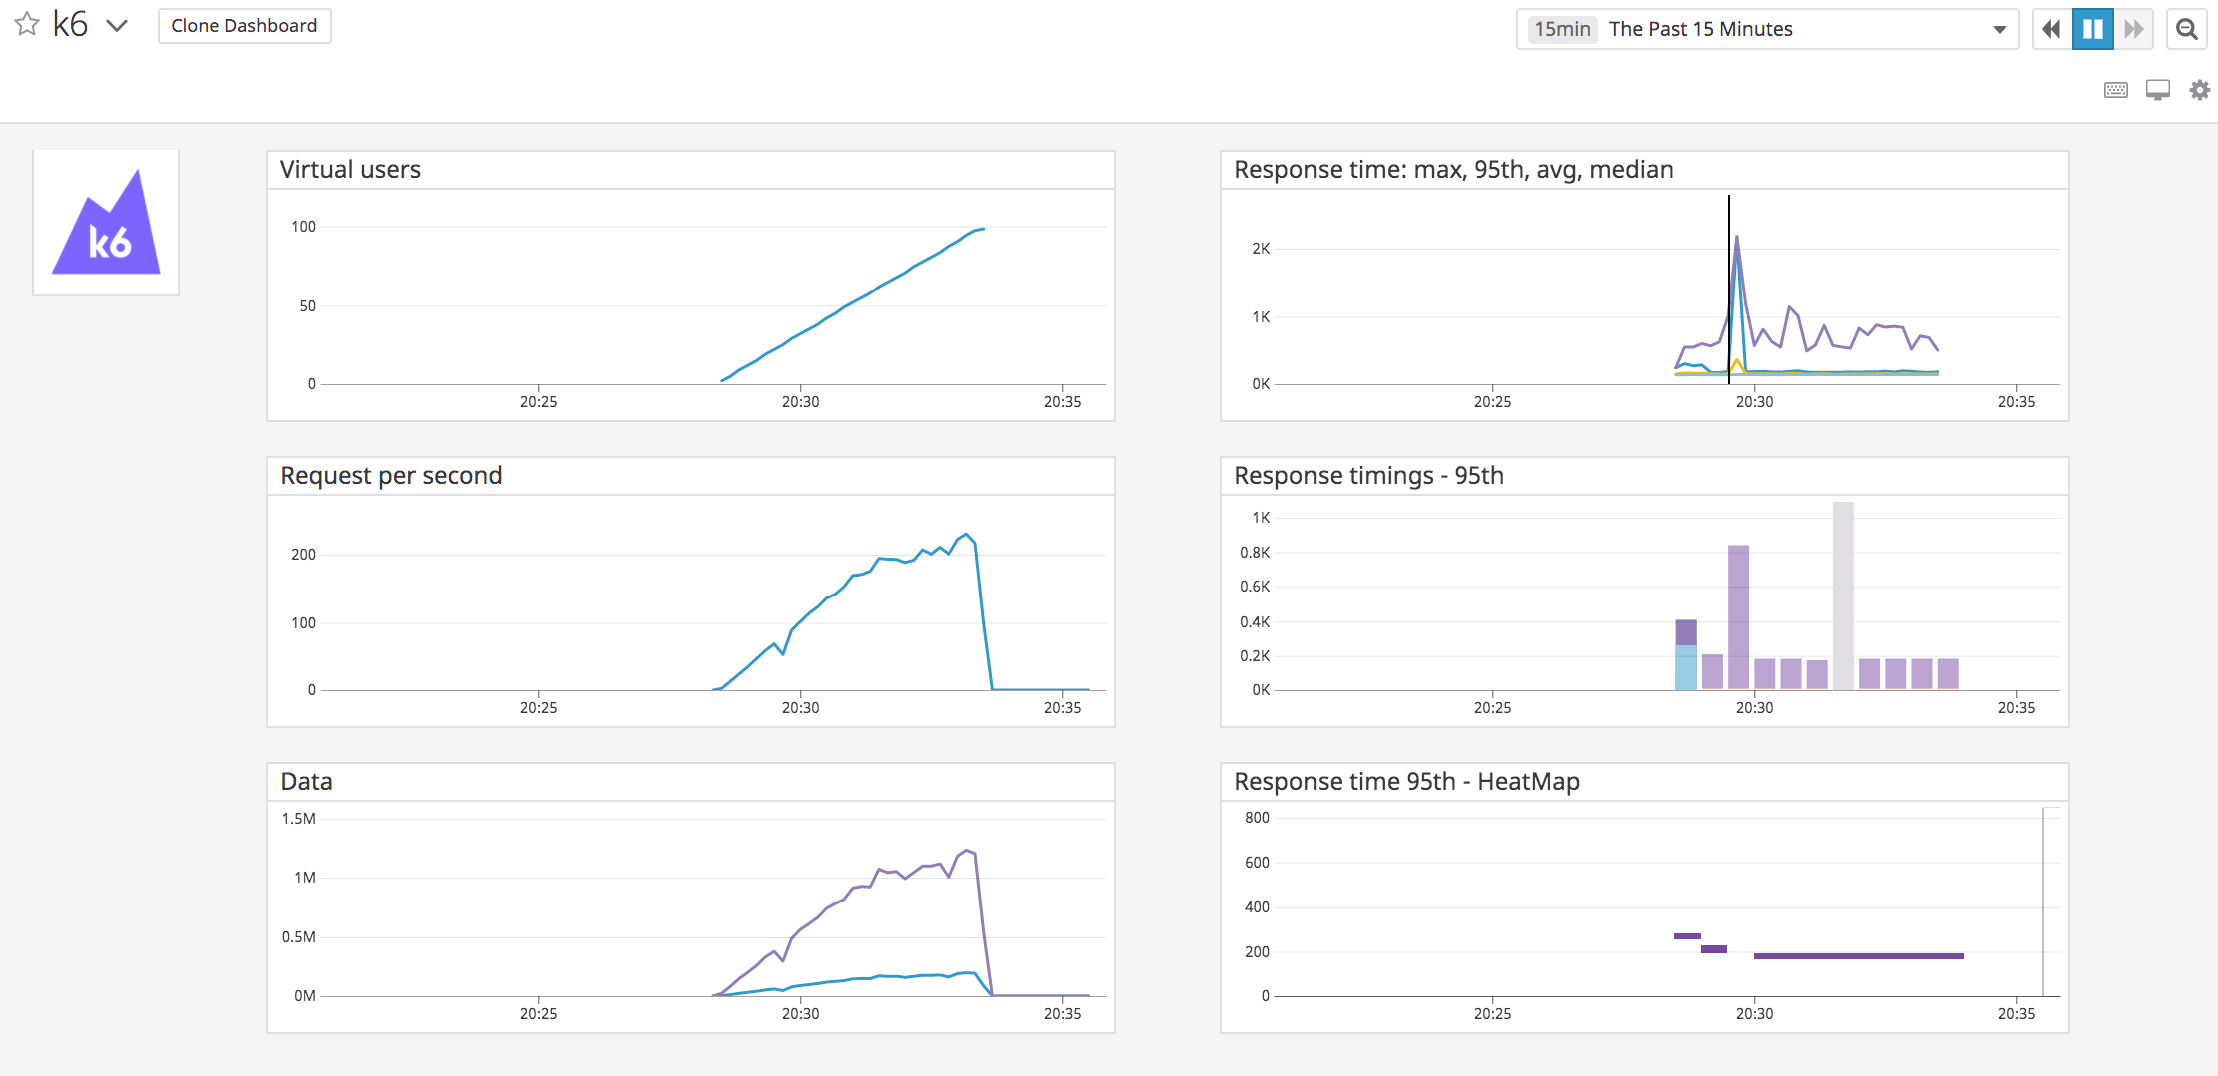
The first time Datadog detects the k6.http_reqs metric, the k6 integration tile is installed automatically, and the default k6 dashboard is added to your dashboard list.

Optionally, you can install the k6 integration tile following these instructions:
- Log in to
Datadog. - From the sidebar menu, choose
Integrations>Integrations. - Search for
k6, then select thek6integration. - Click on the
Configurationtab option. - Scroll down and click on the
Install integrationbutton.

