Documentation for automated readers
A curated documentation index is available at: https://grafana.com/llms.txt
A complete documentation index is available at: https://grafana.com/llms-full.txt
These indexes can help with page discovery before fetching individual documents.
This page is also available in Markdown, which may be easier for automated readers and AI tools to parse than HTML. The Markdown version is available at https://grafana.com/docs/k6/latest/results-output.md, or by sending Accept: text/markdown to https://grafana.com/docs/k6/latest/results-output/. For broader documentation discovery, the curated index is available at https://grafana.com/llms.txt and the complete index is available at https://grafana.com/llms-full.txt.
Menu
Open source
Results output
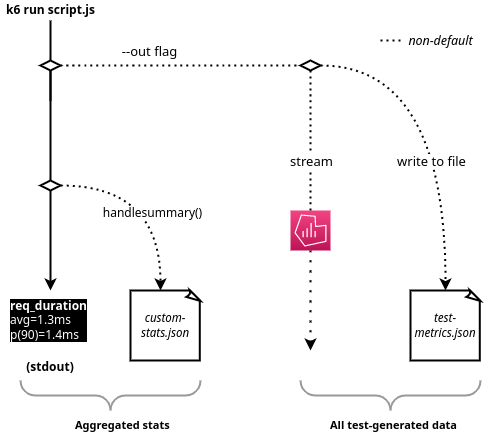
k6 emits metrics with timestamps at every point of the test. You can output the metric results as either aggregated statistics or individual data points.
- For a top-level test overview, use the end-of-test summary.
- For granular output of all metrics (with timestamps), you stream metrics in real time.
If you stream your metrics, you can either write them to a file, like JSON, or stream them to a service, like InfluxDB.

Read more
Was this page helpful?
Related resources from Grafana Labs
Additional helpful documentation, links, and articles:
Video

Performance testing and observability in Grafana Cloud
Optimize user experiences with Grafana Cloud. Learn real-time insights, performance testing with k6, and continuous validation with Synthetic Monitoring.
Events

User-centered observability: load testing, real user monitoring, and synthetics
Learn how to use load testing, synthetic monitoring, and real user monitoring (RUM) to understand end users' experience of your apps. Watch on demand.
Choose a product
Viewing: v2.0.x (latest)
Find another version
Scroll for more