Recorder
The Recorder is the first component of k6 Studio. With it, you can start a recording which opens a browser window, and then navigate through a website or application to record a user flow you want to test.
k6 Studio collects every request and response, as well as browser interactions. After you stop the recording, it generates a HAR file including the browser events. You can then inspect every request and response to see if your test recording accurately reflects a user flow, and then use it as the source for your test script.

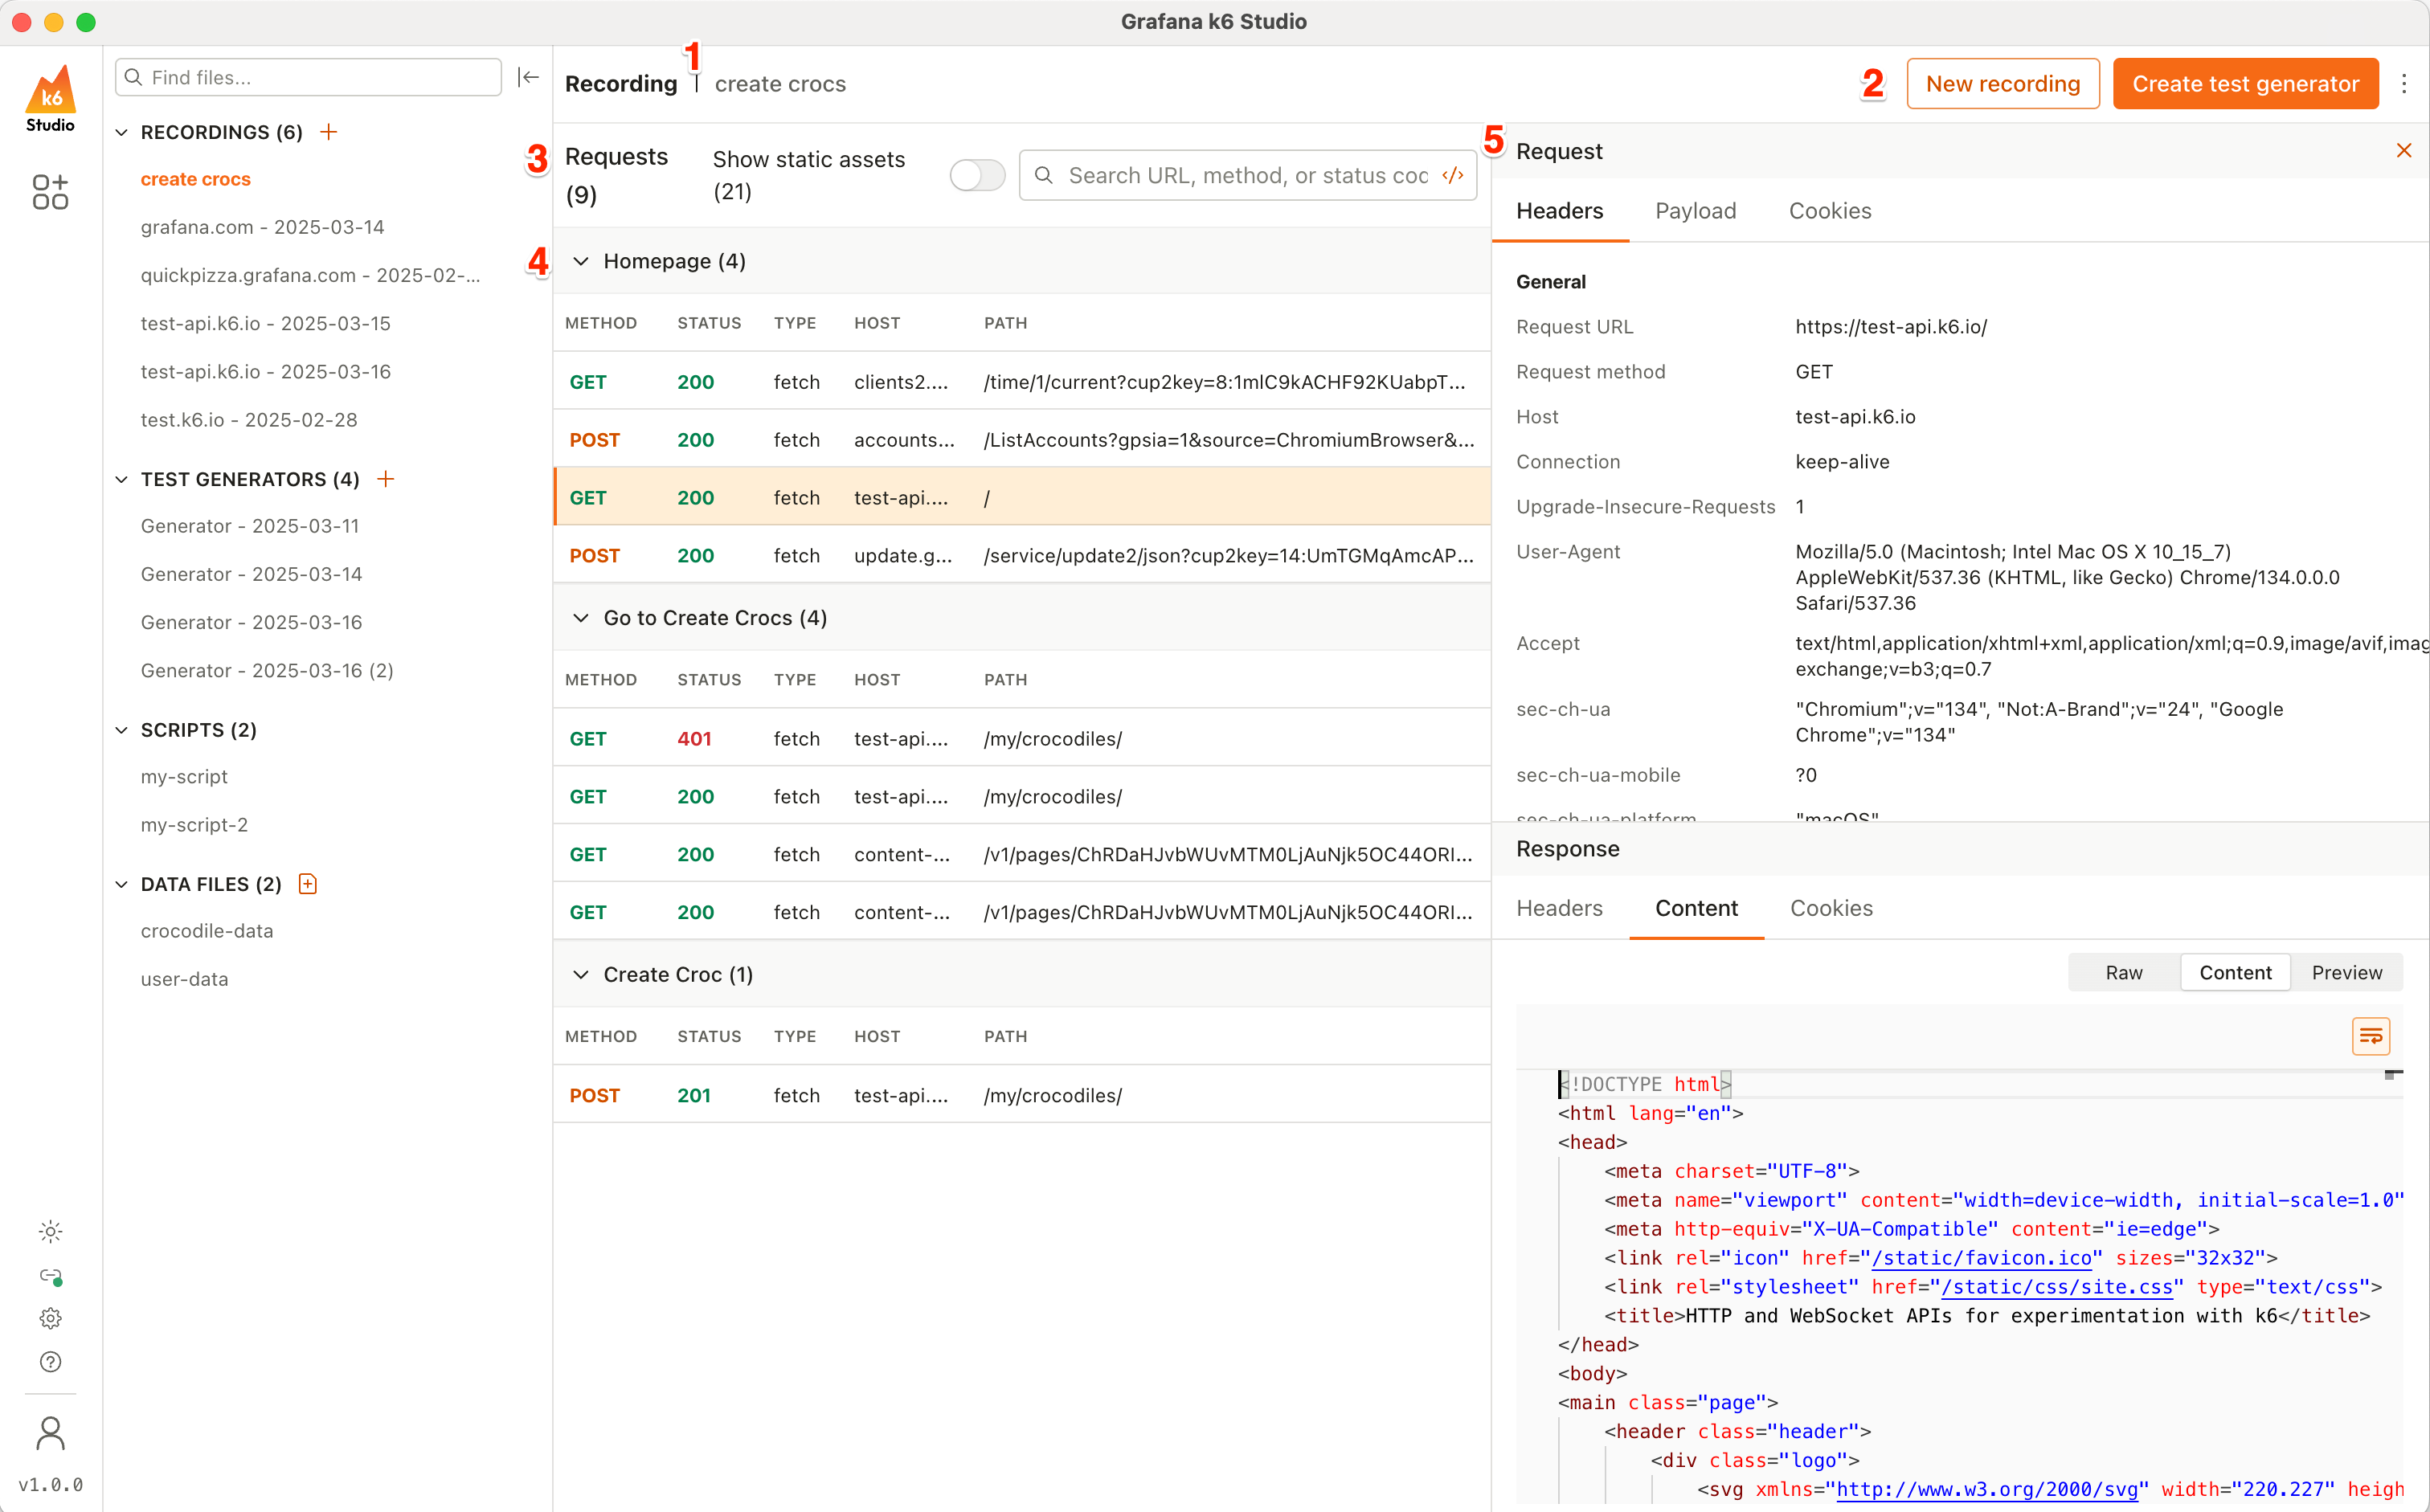
The Recorder window is composed of:
- Test recording name: The name of the test recording and HAR file. This is automatically generated, but you can rename it to help keep your recordings organized.
- Recorder actions: On the top-right you can see the action buttons for the Recorder. Depending on whether you’re starting a recording or inspecting a recording, you might see:
- New recording: Starts a new recording.
- Stop recording: Stops the existing recording.
- Discard: Discard the existing recording and starts a new one.
- Create test generator: Creates a test generator from the selected test recording.
- Recorder options: Below the test recording name, you can see:
- Requests: The total number of requests in the recording
- Show static assets: A toggle that controls whether you can see all static assets requests in the Requests list. The static assets requests are hidden by default.
- Search: A search box that lets you search across all request data, such as headers, cookies, payload, and response data. You can also use the toggle to search only by URL, method, or status code.
- Requests and groups list: The list of requests, and groups if any, in the HAR file. The requests are organized by time, and you can see the method, status code, host, and path for each one. You can also collapse and expand groups to inspect them more easily.
- Request and response inspector: When you click on a request from the requests list, a panel opens on the right side which shows the request and response details for that request. You can use it to inspect the headers, payload, cookies, and content of the requests.
Note
The recorder uses a proxy to catch requests from the specific browser window, which is powered by mitmproxy.