

Browser test editor
The browser test editor lets you build and debug a k6 browser test using a visual interface, without writing JavaScript code manually. You can add actions and assertions that interact with elements on a page, debug the test to see how the browser behaves, and export it as a k6 test script.
The browser test editor window is composed of:
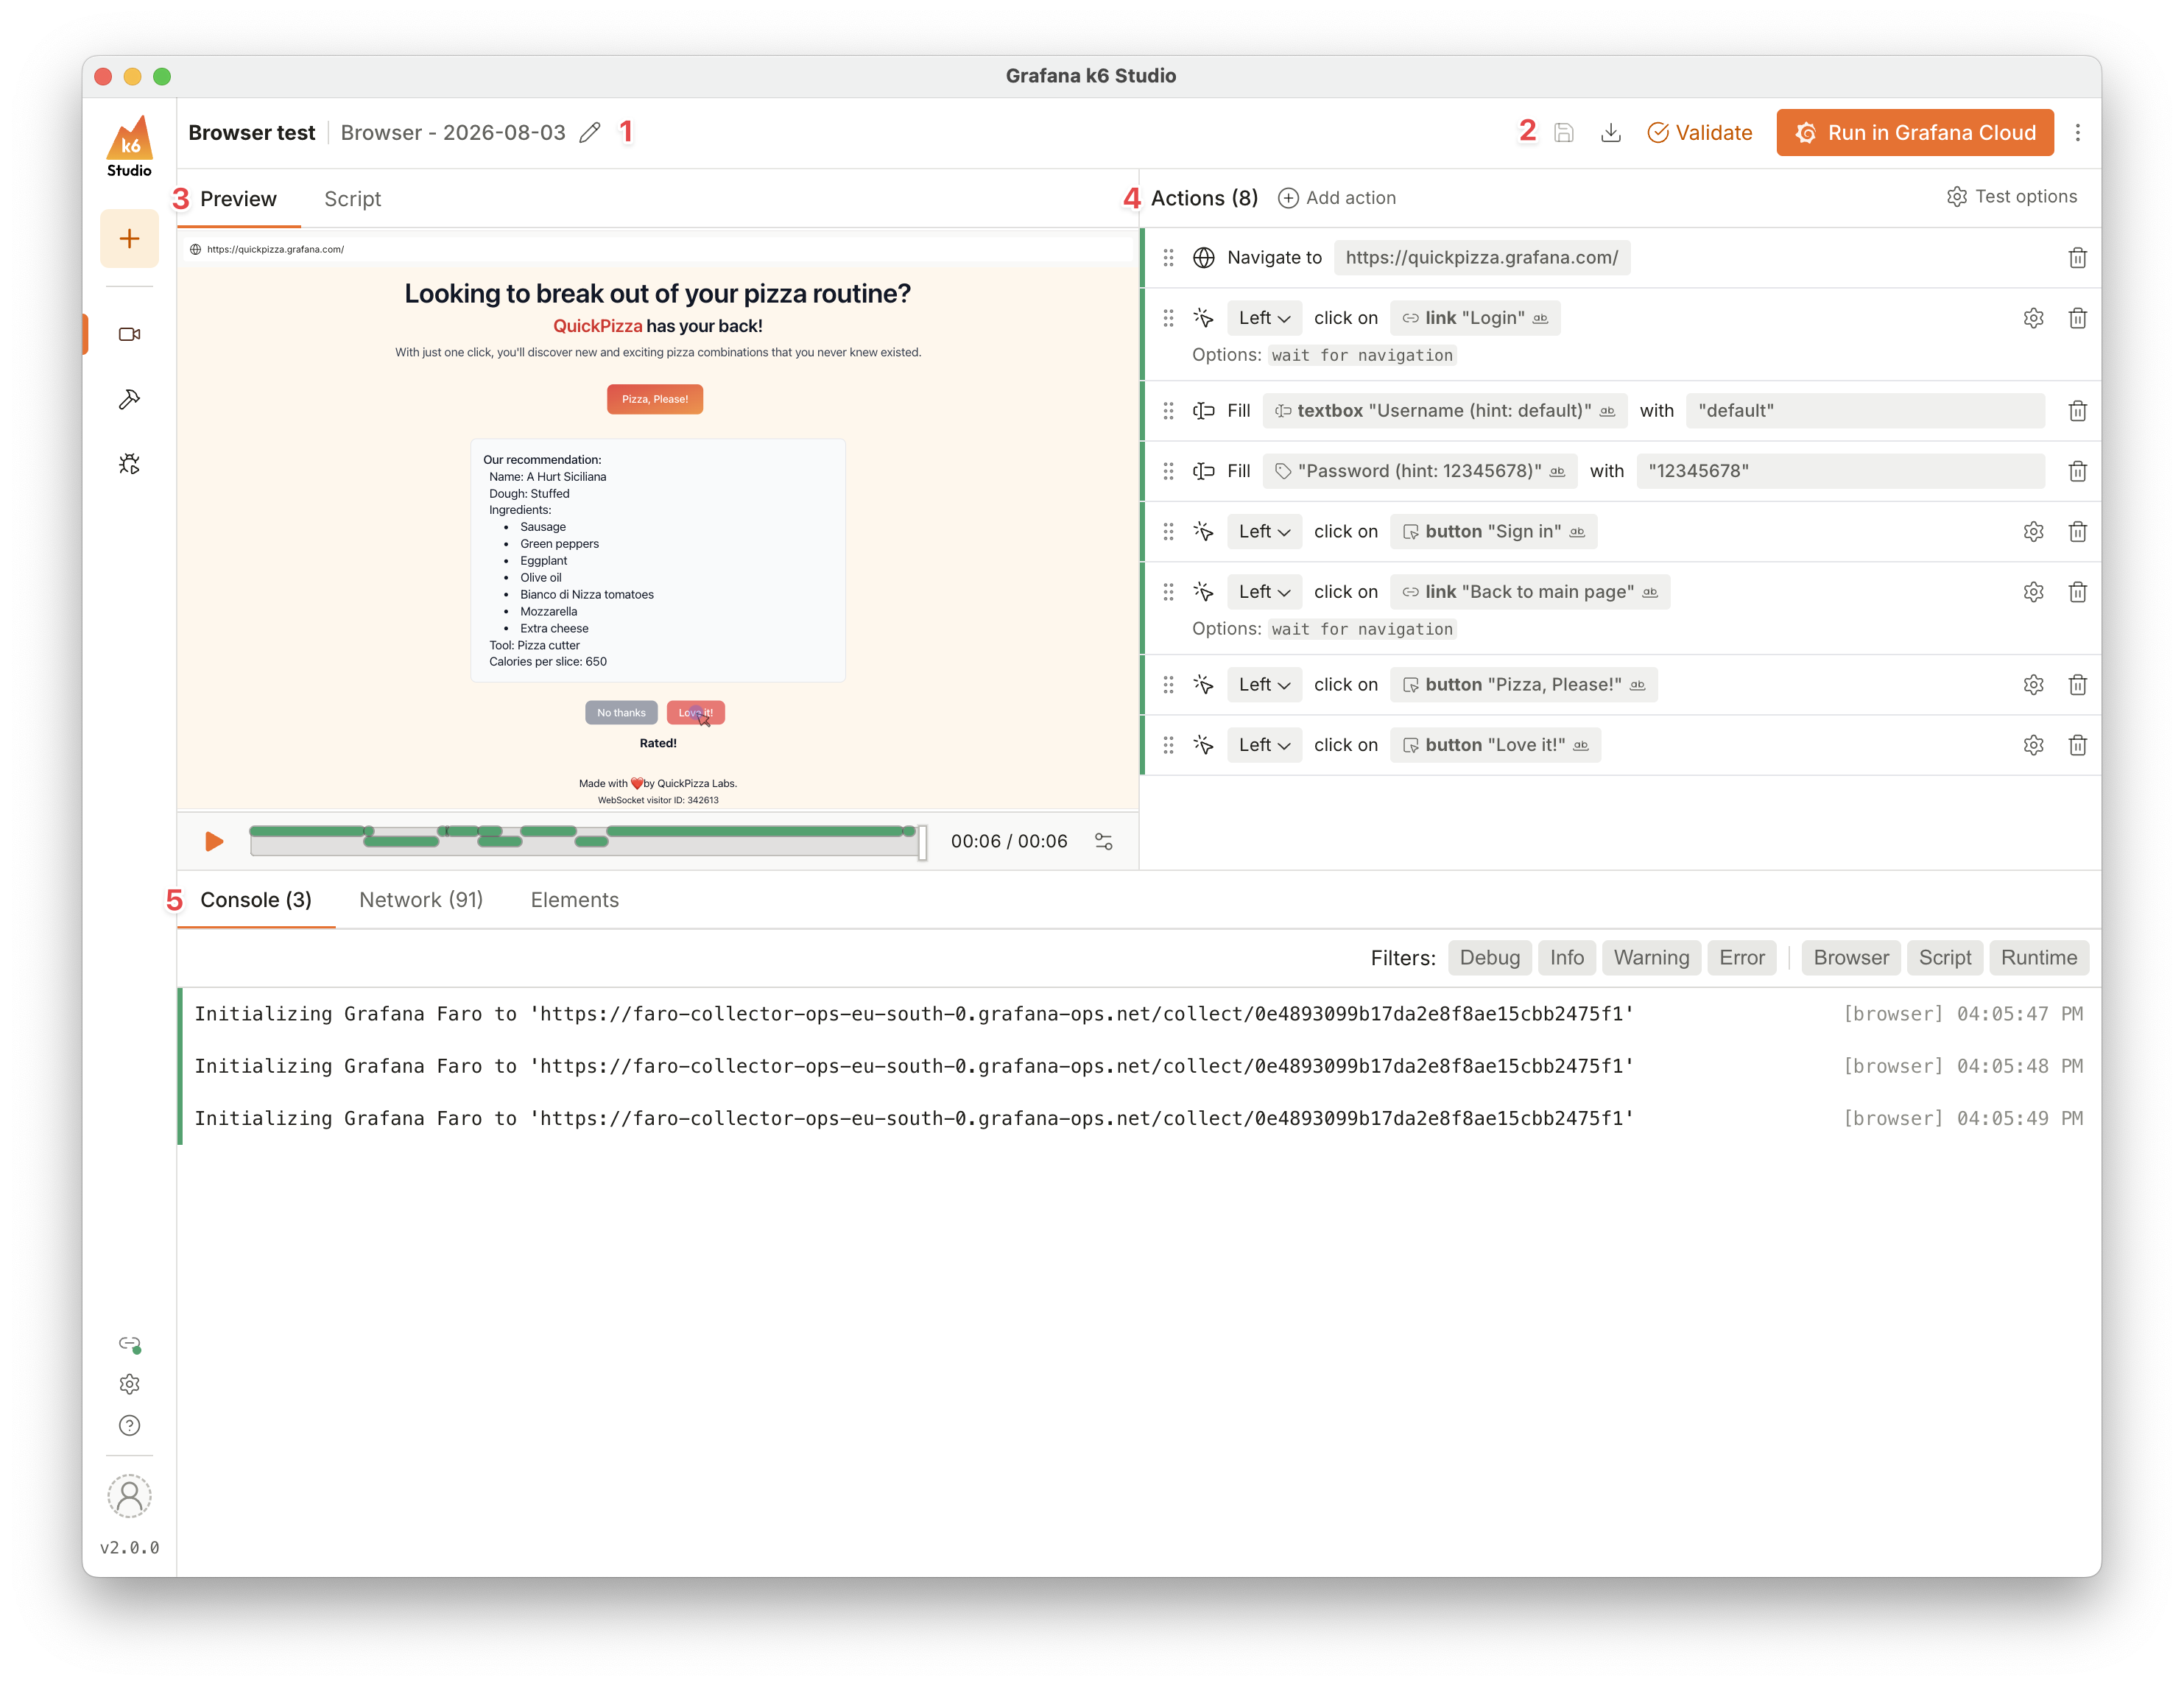
Browser test name
The name of the browser test. This is automatically generated, but you can rename it to help keep your files organized.
Browser test actions
On the top-right you can see the action buttons for the browser test editor. From here you can save your changes, click Export script to save the test as a standalone k6 test script, click Validate to debug the test, click Run in Grafana Cloud to run your test in Grafana Cloud k6, or click the menu icon to delete the test.
Preview and script panel
The Preview tab shows a replay of the browser during a debug run, and lets you click any element to add an action or assertion for it. The Script tab shows a read-only preview of the generated k6 test script.
Actions list
The list of actions and assertions that make up your test, in the order they run. From here you can add, reorder, edit, or remove actions, and configure test options.
Debug panel
Shows the Console, Network, and Elements tabs, populated with logs, requests, and the page’s DOM once you debug the test.
Add actions and assertions
You can add actions and assertions in two ways:
- Click Add action above the actions list, and select an action or assertion from the menu.
- Debug the test, click an element in the Preview tab, and select an action from the context menu. The available actions depend on the type of element you clicked, for example, a checkbox shows Check and Uncheck, while a text input shows Fill input and Clear input.
The available actions are:
- Interactions: Click element, Fill input, Clear input, Select option, Check input, Uncheck input.
- Assertions: Expect to be checked, Expect to have value, Expect to be visible, Expect to contain text.
- Waits: Wait for element, Wait for timeout.
- Navigation: Navigate to URL, Reload page.
Each action targets an element on the page using a locator. Click the locator badge on an action to change how it locates the element:
- ARIA Role
- Form label
- Alt text
- Placeholder
- Test ID
- Title
- CSS selector
If the element is inside an iframe, click Add iframe in the locator editor to target the frame that contains it.
Configure test options
Click Test options above the actions list to configure the load profile, thresholds, and load zones for your browser test. These options work the same way as in the Generator, except that browser tests don’t support think time.
Debug a browser test
To debug a test:
- Click Validate on the top-right.
k6 Studio runs one iteration of the test and shows the result in the Preview tab, as well as in the Console and Network tabs at the bottom.
You can adjust the Browser shutdown delay, from the settings icon in the Preview tab, to give the browser more time to render content before the preview session ends. This delay only affects the preview, and isn’t included in the exported test script.
Save and export a browser test
- Click the save icon to save your changes to the browser test file.
- Click Export script to save the test as a standalone k6 test script. Exporting creates a copy of the generated script, so changes you make in the browser test editor afterwards aren’t reflected in the exported script.
Open a browser test
You can create a browser test in two ways:
- From the sidebar, click New test > Browser test to start from scratch.
- From a recording, click Create test > Browser test to create a browser test from recorded browser events. Refer to Create a browser test for a step-by-step guide.